sox1 (Proteintech)
93
Structured Review
Proteintech
sox1

Sox1, supplied by Proteintech, used in various techniques. Bioz Stars score: 93/100, based on 6 PubMed citations. ZERO BIAS - scores, article reviews, protocol conditions and more
https://www.bioz.com/result/sox1/product/Proteintech
Average 93 stars, based on 6 article reviews
Sox1, supplied by Proteintech, used in various techniques. Bioz Stars score: 93/100, based on 6 PubMed citations. ZERO BIAS - scores, article reviews, protocol conditions and more
https://www.bioz.com/result/sox1/product/Proteintech
Average 93 stars, based on 6 article reviews
sox1 - by Bioz Stars,
2026-02
93/100 stars
Images
1) Product Images from "Stage-Specific Alternative Polyadenylation During Human Neural Differentiation Revealed by Integrated Long- and Short-Read Sequencing"
Article Title: Stage-Specific Alternative Polyadenylation During Human Neural Differentiation Revealed by Integrated Long- and Short-Read Sequencing
Journal: Biology
doi: 10.3390/biology15010024
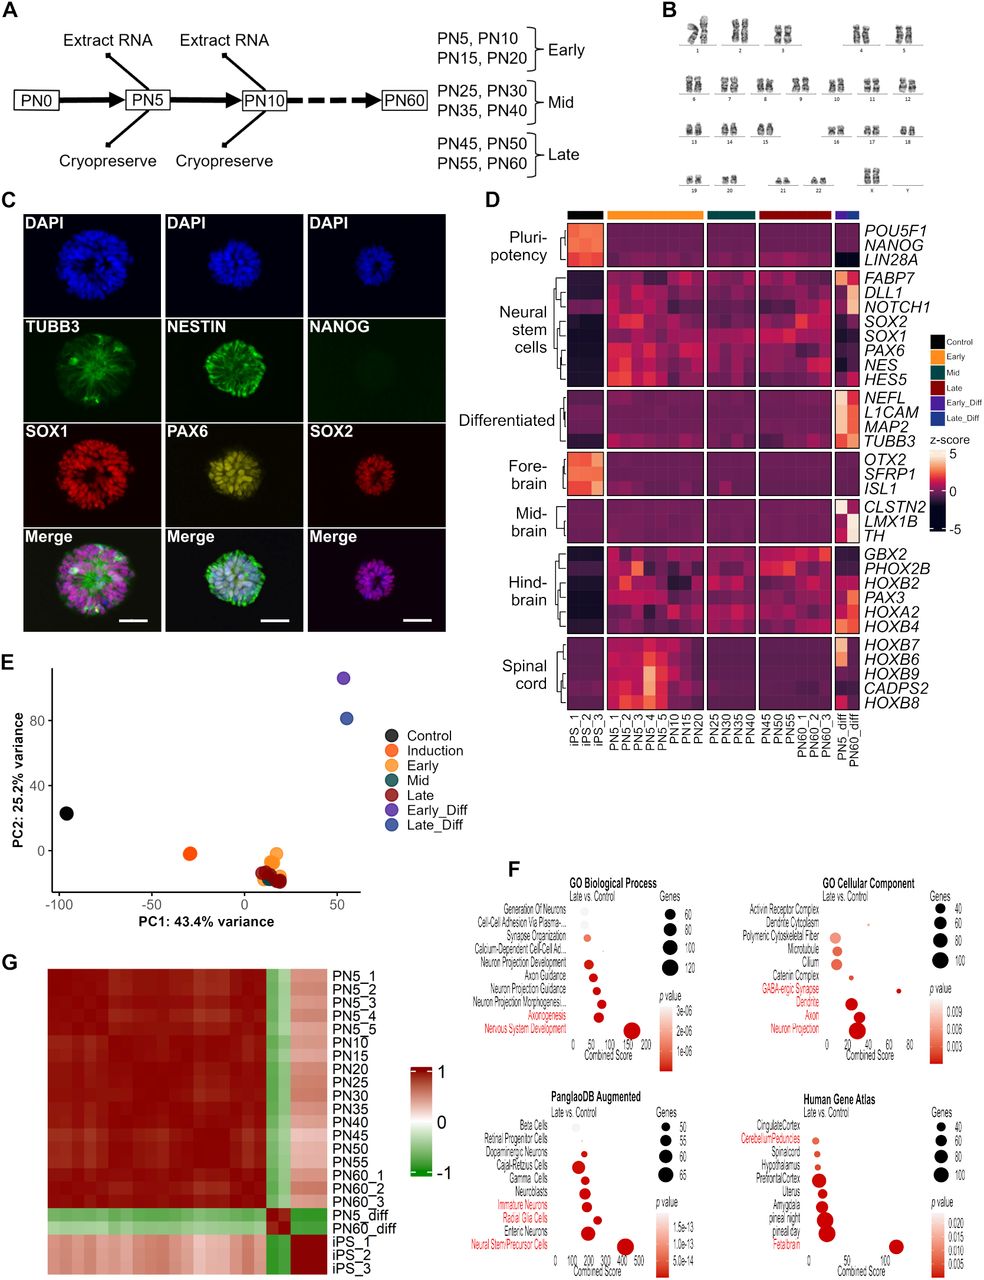
Figure Legend Snippet: Immunofluorescence staining showing the expression of neural stem/progenitor cell markers in H9-derived cells. The cell nuclei are labeled with DAPI (blue). Nestin was detected in green. OCT4, NANOG, and SOX1 were detected in red. PAX6 was detected in red in NSCs and in green in NPCs. Scale bar = 50 μm. Original figures see .
Techniques Used: Immunofluorescence, Staining, Expressing, Derivative Assay, Labeling