Review


rabbit anti human cd33  (Bioss)


Bioz Verified Symbol Bioss is a verified supplier
Bioz Manufacturer Symbol Bioss manufactures this product  
  • Logo
  • About
  • News
  • Press Release
  • Team
  • Advisors
  • Partners
  • Contact
  • Bioz Stars
  • Bioz vStars
  • 94

    Structured Review

    Bioss rabbit anti human cd33
    a. A schematic of <t>CD33/Siglec-3</t> long (CD33 M )( Top ), short (CD33 m ) ( Middle ) and CD33 MΔ4bp ( Bottom ) isoforms indicating signal peptide (sig pep, green), two Ig-like domains (blue, purple), transmembrane helix (red) and cytoplasmic tail (yellow). Glycosylation sites are indicated by red lollipops and disulphide bonds by black lines connecting Cys residues. b. Cartoon of the CD33 M ECD structure in two views rotated 90° about the vertical axis. The sheets in the V-set domain are green (C′CFGG′A) and blue (ABED), and the C2-set domain pink (CFG) and purple (ABED). The variable CC′ and GG′ loops are coloured purple and orange, respectively. The V-set domain is stabilised by a disulphide bond between the BBʹ loop (Cys 41) and the E strand (Cys 101). The three N -linked GlcNAc residues attached to the V-set domain (Asn100) and C2-set domain (Asn160 and 209) are shown in stick form and labelled by the amino acid to which they are linked c. A cartoon of the CD33 V-set domain structure highlighting important features for binding, and regions of difference to other siglec structures. Arg119, required for binding sialic acid, is shown in stick form (magenta). Regions of significant deviation to other siglecs are limited to the BC loop and the CC’ loop. The CC‘ loop occupies conformations varying from more open (CD33 M ) to closed (Siglec-5) over the binding site. d. Images of the ligand binding sites with bound 3′-sialyllactose. The polypeptide chain is shown in cartoon representation with the residues constituting the binding site in stick form. The sialyllactoses are shown in ball-and-stick format (carbon atoms – light blue, oxygen – red, nitrogen – dark blue) with omit mFo-DFc electron density contoured at 2 σ. The electron density maps were supportive of inclusion of sialic acid and Gal residues, but insufficient to model Glc. The CC′ loop is indicated and, in contrast to other Siglecs, makes no direct interactions with the ligands. e. Images of the ligand binding sites with bound 6′-sialyllactose.
    Rabbit Anti Human Cd33, supplied by Bioss, used in various techniques. Bioz Stars score: 94/100, based on 3 PubMed citations. ZERO BIAS - scores, article reviews, protocol conditions and more
    https://www.bioz.com/result/rabbit anti human cd33/product/Bioss
    Average 94 stars, based on 3 article reviews
    rabbit anti human cd33 - by Bioz Stars, 2026-02
    94/100 stars

    Images

    1) Product Images from "CD33 and clusterin interact biophysically and genetically to modulate Alzheimer risk"

    Article Title: CD33 and clusterin interact biophysically and genetically to modulate Alzheimer risk

    Journal: bioRxiv

    doi: 10.1101/2025.07.29.667318

    a. A schematic of CD33/Siglec-3 long (CD33 M )( Top ), short (CD33 m ) ( Middle ) and CD33 MΔ4bp ( Bottom ) isoforms indicating signal peptide (sig pep, green), two Ig-like domains (blue, purple), transmembrane helix (red) and cytoplasmic tail (yellow). Glycosylation sites are indicated by red lollipops and disulphide bonds by black lines connecting Cys residues. b. Cartoon of the CD33 M ECD structure in two views rotated 90° about the vertical axis. The sheets in the V-set domain are green (C′CFGG′A) and blue (ABED), and the C2-set domain pink (CFG) and purple (ABED). The variable CC′ and GG′ loops are coloured purple and orange, respectively. The V-set domain is stabilised by a disulphide bond between the BBʹ loop (Cys 41) and the E strand (Cys 101). The three N -linked GlcNAc residues attached to the V-set domain (Asn100) and C2-set domain (Asn160 and 209) are shown in stick form and labelled by the amino acid to which they are linked c. A cartoon of the CD33 V-set domain structure highlighting important features for binding, and regions of difference to other siglec structures. Arg119, required for binding sialic acid, is shown in stick form (magenta). Regions of significant deviation to other siglecs are limited to the BC loop and the CC’ loop. The CC‘ loop occupies conformations varying from more open (CD33 M ) to closed (Siglec-5) over the binding site. d. Images of the ligand binding sites with bound 3′-sialyllactose. The polypeptide chain is shown in cartoon representation with the residues constituting the binding site in stick form. The sialyllactoses are shown in ball-and-stick format (carbon atoms – light blue, oxygen – red, nitrogen – dark blue) with omit mFo-DFc electron density contoured at 2 σ. The electron density maps were supportive of inclusion of sialic acid and Gal residues, but insufficient to model Glc. The CC′ loop is indicated and, in contrast to other Siglecs, makes no direct interactions with the ligands. e. Images of the ligand binding sites with bound 6′-sialyllactose.
    Figure Legend Snippet: a. A schematic of CD33/Siglec-3 long (CD33 M )( Top ), short (CD33 m ) ( Middle ) and CD33 MΔ4bp ( Bottom ) isoforms indicating signal peptide (sig pep, green), two Ig-like domains (blue, purple), transmembrane helix (red) and cytoplasmic tail (yellow). Glycosylation sites are indicated by red lollipops and disulphide bonds by black lines connecting Cys residues. b. Cartoon of the CD33 M ECD structure in two views rotated 90° about the vertical axis. The sheets in the V-set domain are green (C′CFGG′A) and blue (ABED), and the C2-set domain pink (CFG) and purple (ABED). The variable CC′ and GG′ loops are coloured purple and orange, respectively. The V-set domain is stabilised by a disulphide bond between the BBʹ loop (Cys 41) and the E strand (Cys 101). The three N -linked GlcNAc residues attached to the V-set domain (Asn100) and C2-set domain (Asn160 and 209) are shown in stick form and labelled by the amino acid to which they are linked c. A cartoon of the CD33 V-set domain structure highlighting important features for binding, and regions of difference to other siglec structures. Arg119, required for binding sialic acid, is shown in stick form (magenta). Regions of significant deviation to other siglecs are limited to the BC loop and the CC’ loop. The CC‘ loop occupies conformations varying from more open (CD33 M ) to closed (Siglec-5) over the binding site. d. Images of the ligand binding sites with bound 3′-sialyllactose. The polypeptide chain is shown in cartoon representation with the residues constituting the binding site in stick form. The sialyllactoses are shown in ball-and-stick format (carbon atoms – light blue, oxygen – red, nitrogen – dark blue) with omit mFo-DFc electron density contoured at 2 σ. The electron density maps were supportive of inclusion of sialic acid and Gal residues, but insufficient to model Glc. The CC′ loop is indicated and, in contrast to other Siglecs, makes no direct interactions with the ligands. e. Images of the ligand binding sites with bound 6′-sialyllactose.

    Techniques Used: Glycoproteomics, Binding Assay, Ligand Binding Assay

    Structural alignments of i – four CD33 V-set domain structures: 5IHB (lime), 6D48 (purple), 7AW6 (blue) and AF_P20138_F1 (AlphaFold2 model, green); ii V-set domains of sialoadhesin (1OD9, red), CD33 (blue), Siglec-5 (2ZG2, green) and Siglec-7 (2HRL, purple). Significant deviations are limited to the BC loop and the CC′ loop. The CC′ loop occupies conformations varying from more open (CD33 M ) to closed (Siglec-5) over the binding site; iii full-length ECDs of 5IHB (cyan) and 7AW6 (purple) aligned on C2-set domain only. All structures were aligned using the align algorithm in PyMOL.
    Figure Legend Snippet: Structural alignments of i – four CD33 V-set domain structures: 5IHB (lime), 6D48 (purple), 7AW6 (blue) and AF_P20138_F1 (AlphaFold2 model, green); ii V-set domains of sialoadhesin (1OD9, red), CD33 (blue), Siglec-5 (2ZG2, green) and Siglec-7 (2HRL, purple). Significant deviations are limited to the BC loop and the CC′ loop. The CC′ loop occupies conformations varying from more open (CD33 M ) to closed (Siglec-5) over the binding site; iii full-length ECDs of 5IHB (cyan) and 7AW6 (purple) aligned on C2-set domain only. All structures were aligned using the align algorithm in PyMOL.

    Techniques Used: Binding Assay

    Left panel - Cartoon showing a structural alignment between the C2-set domains of CD33 (green) and Siglec-5 (blue), with an RMSD = 0.93 Å. Whereas the CD33 domain possesses a D strand, the region between the C and E strands in Siglec-5 occupies a non-regular loop conformation Right panel: Structural alignment of the C2-set domains of CD33 (green) and ICAM-3 (purple). Both domains possess a D strand. RMSD = 1.9 Å.
    Figure Legend Snippet: Left panel - Cartoon showing a structural alignment between the C2-set domains of CD33 (green) and Siglec-5 (blue), with an RMSD = 0.93 Å. Whereas the CD33 domain possesses a D strand, the region between the C and E strands in Siglec-5 occupies a non-regular loop conformation Right panel: Structural alignment of the C2-set domains of CD33 (green) and ICAM-3 (purple). Both domains possess a D strand. RMSD = 1.9 Å.

    Techniques Used:

    A schematic of the ligand binding site showing the interactions between CD33 and 3’-sialyllactose (identical interactions are seen for 6’-sialyllactose). No interactions are made with the galactose or glucose residues. Figure prepared using PoseView.
    Figure Legend Snippet: A schematic of the ligand binding site showing the interactions between CD33 and 3’-sialyllactose (identical interactions are seen for 6’-sialyllactose). No interactions are made with the galactose or glucose residues. Figure prepared using PoseView.

    Techniques Used: Ligand Binding Assay

    a. Cartoon showing the dimerization of two CD33 M ectodomain chains (teal and pink) mediated by their C2-set domains. The two C strands hydrogen bond in a parallel fashion to create a continuous β-sheet (GFCCFG) and the remainder of the interface is formed by residues from the CD33-specific D strand. The C2-set dimeric interface and the rigid nature of the V-set/C2-set interface places the two ligand binding sites 40 Å apart, facing outwards from the central axis of the dimer and pointing away from one another. b. Surface representation of CD33 M ectodomain colour-coded according to conservation (purple – conserved, cyan – non-conserved). The conserved patch constituting the dimer interface is indicated. c. Dimeric CD33 M is robustly targeted to the cell surface in both CD33 M /CD33 M and CD33 M /CD33 m expressing cells : representative flow cytometry analyses showing CD33 M and CD33 m surface labelling in cells expressing CD33 M only (CD33 M / M ), CD33 m only (CD33 m / m ) or CD33 M and CD33 m (CD33 M / m ), reveals that the majority of both CD33 M / M and CD33 M / m cells have similarly robust surface exposure of CD33 M . We were not able to include CD33 M-5X cells in these experiments because the 5X dimer site mutant disrupts the recognition motif for the anti-CD33 antibody that recognizes CD33 M in fluorescence flow cytometry. Cells were double stained using antibodies specific to CD33 M (WM53) and CD33 m (A16121H) respectively shows, in the displayed experiment (see ), that most CD33 M / M cells (upper left, Q1+Q2: 93.8% + 0.62%) or CD33 M / m cells (upper right, Q1+Q2: 71.5% + 23.3%) are surface CD33 M positive. Only a small portion of cells in CD33 M / m cells (upper right, Q2+Q3: 23.3% + 0.11%) are CD33 m positive. In the CD33 m / m (lower left, Q2+Q3: 0.25% + 43.6%) cells, CD33 m positive cells are less than a half of the total cells. Figures show one experiment out of three independent experiments (each with 6 technical replicates) with similar results. The MFI statistics of CD33M and CD33m from three independent experiments are shown in Extended Figure 2J d. Single staining using the HIM3-4 antibody, which recognises both CD33 M and CD33 m , shows much greater surface exposure of CD33 M in CD33 M / M cells (red) than there is surface exposure of CD33 m in CD33 m / m (green) cells. e. Schematic of single-molecule TIRF imaging of CHO cells expressing SNAP f -CD33 M labeled with donor and acceptor fluorophores . The colours on the dimer cartoon reflect the same CD33 domains as in . f. Representative smFRET trajectory and its corresponding fluorescence and FRET time traces for the CD33 M receptor (bottom panel). The smFRET trajectory for the individual molecule is shown to the left of its fluorescence (donor and acceptor trajectories and intensities are shown in green and red, respectively) and FRET trace (in blue). The green and red bars along the time axis in the fluorescence time trace plot indicate that the signal was derived during tracking. g. Top panels: Representative image from a movie (frame 2, 0.03 s) of labeled SNAP f - CD33 M e xcited by the donor laser (532 nm), with the enlarged view (bottom panels) showing sensitized acceptor signals that have colocalizing trajectories with their corresponding donors, both delineated by white circles. (See cartoon in Supplementary Figure 2K for methodology) Scale bar, 5 μm; enlarged view, 9.1 μm × 7.3 μm. Donors without colocalized acceptor are consistent with the stochastic labeling approach employed in which a population of dimers labeled with two donors or only one donor and no acceptor is possible. h. Distributions of smFRET events per cell area for SNAP f -CD33 M , -CD33 M-5X , and -CD33 m , all labeled with donor and acceptor (Don-Acc) as well as SNAP f -CD33 M labeled with only donor (Don-only). The smFRET events represent the total number of freely diffusing smFRET trajectories (see cartoon in Supplementary Figure 2K for methodology). Dots represent smFRET events per area for each cell. Box plots indicate the median (value shown as the central line) and interquartile range (lower and upper lines represent the 25th and 75th percentiles, respectively), while the whiskers represent the points that fall within 1.5 × interquartile range. The indicated total number of cells ( n cells) were collected over 4 independent experiments for the CD33 M and CD33 m samples, and 3 independent experiments for the CD33 M-5X and CD33 M donor only samples. ***, p = 1.3 × 10 -8 ; ***, p = 1.6 × 10 -8 ; **, p = 0.0056; *, p = 0.011; ns = 0.99; ordinary one-way ANOVA with Šídák’s post- hoc multiple comparisons test. i. CD33 MΔ4bp variant forms a stable soluble protein in cell lysates and is secreted into the media , where it may bind with the extracellular domains of CD33 M and CD33 m . There may be a similar physiological soluble CD33 protein that is either shed into the medium by CD33 M ectodomain proteolysis or is produced as an alternative splicing product. A cartoon showing the domain structures and epitope tags of CD33 M , CD33 m , CD33 Δ4bp and the putative soluble CD33 M ectodomain product (sCD33 M ) is included in . j. Western blot analysis of CD33 immunoprecipitated by the CD33 Ig-like V-set domain antibody (ab134115) from lysates and conditioned medium of iMGs . Immunoprecipitation products were probed for CD33 using the CD33 Ig-like C2-set domain antibody (PWS44). The data demonstrate the presence of fuzzy, likely glycosylated soluble CD33- immunoreactvive (sCD33) cleavage product in the medium, but not in iMG cell lysates. Notably, sCD33 increases upon stimulation of the iMG cells with 300 nM CLU (lane 5). k. Western blot of lysates and HA-immunoprecipitation products from HEK293 cells expressing CD33 M -HA, CD33 m -HA and CD33 MΔ4bp. HA-immunoprecipitation products were probed with the anti-CD33 antibody (ab134115) which recognises only epitopes in the V-set domain. Arrowheads denote CD33 derivative protein. Representative blots for n = 3 independent biological replicates. The result reveals that CD33 MΔ4bp co-precipitates with CD33 M and CD33 m . These studies do not distinguish whether this interaction occurs in the intracellular compartment or whether they occur at the cell surface.
    Figure Legend Snippet: a. Cartoon showing the dimerization of two CD33 M ectodomain chains (teal and pink) mediated by their C2-set domains. The two C strands hydrogen bond in a parallel fashion to create a continuous β-sheet (GFCCFG) and the remainder of the interface is formed by residues from the CD33-specific D strand. The C2-set dimeric interface and the rigid nature of the V-set/C2-set interface places the two ligand binding sites 40 Å apart, facing outwards from the central axis of the dimer and pointing away from one another. b. Surface representation of CD33 M ectodomain colour-coded according to conservation (purple – conserved, cyan – non-conserved). The conserved patch constituting the dimer interface is indicated. c. Dimeric CD33 M is robustly targeted to the cell surface in both CD33 M /CD33 M and CD33 M /CD33 m expressing cells : representative flow cytometry analyses showing CD33 M and CD33 m surface labelling in cells expressing CD33 M only (CD33 M / M ), CD33 m only (CD33 m / m ) or CD33 M and CD33 m (CD33 M / m ), reveals that the majority of both CD33 M / M and CD33 M / m cells have similarly robust surface exposure of CD33 M . We were not able to include CD33 M-5X cells in these experiments because the 5X dimer site mutant disrupts the recognition motif for the anti-CD33 antibody that recognizes CD33 M in fluorescence flow cytometry. Cells were double stained using antibodies specific to CD33 M (WM53) and CD33 m (A16121H) respectively shows, in the displayed experiment (see ), that most CD33 M / M cells (upper left, Q1+Q2: 93.8% + 0.62%) or CD33 M / m cells (upper right, Q1+Q2: 71.5% + 23.3%) are surface CD33 M positive. Only a small portion of cells in CD33 M / m cells (upper right, Q2+Q3: 23.3% + 0.11%) are CD33 m positive. In the CD33 m / m (lower left, Q2+Q3: 0.25% + 43.6%) cells, CD33 m positive cells are less than a half of the total cells. Figures show one experiment out of three independent experiments (each with 6 technical replicates) with similar results. The MFI statistics of CD33M and CD33m from three independent experiments are shown in Extended Figure 2J d. Single staining using the HIM3-4 antibody, which recognises both CD33 M and CD33 m , shows much greater surface exposure of CD33 M in CD33 M / M cells (red) than there is surface exposure of CD33 m in CD33 m / m (green) cells. e. Schematic of single-molecule TIRF imaging of CHO cells expressing SNAP f -CD33 M labeled with donor and acceptor fluorophores . The colours on the dimer cartoon reflect the same CD33 domains as in . f. Representative smFRET trajectory and its corresponding fluorescence and FRET time traces for the CD33 M receptor (bottom panel). The smFRET trajectory for the individual molecule is shown to the left of its fluorescence (donor and acceptor trajectories and intensities are shown in green and red, respectively) and FRET trace (in blue). The green and red bars along the time axis in the fluorescence time trace plot indicate that the signal was derived during tracking. g. Top panels: Representative image from a movie (frame 2, 0.03 s) of labeled SNAP f - CD33 M e xcited by the donor laser (532 nm), with the enlarged view (bottom panels) showing sensitized acceptor signals that have colocalizing trajectories with their corresponding donors, both delineated by white circles. (See cartoon in Supplementary Figure 2K for methodology) Scale bar, 5 μm; enlarged view, 9.1 μm × 7.3 μm. Donors without colocalized acceptor are consistent with the stochastic labeling approach employed in which a population of dimers labeled with two donors or only one donor and no acceptor is possible. h. Distributions of smFRET events per cell area for SNAP f -CD33 M , -CD33 M-5X , and -CD33 m , all labeled with donor and acceptor (Don-Acc) as well as SNAP f -CD33 M labeled with only donor (Don-only). The smFRET events represent the total number of freely diffusing smFRET trajectories (see cartoon in Supplementary Figure 2K for methodology). Dots represent smFRET events per area for each cell. Box plots indicate the median (value shown as the central line) and interquartile range (lower and upper lines represent the 25th and 75th percentiles, respectively), while the whiskers represent the points that fall within 1.5 × interquartile range. The indicated total number of cells ( n cells) were collected over 4 independent experiments for the CD33 M and CD33 m samples, and 3 independent experiments for the CD33 M-5X and CD33 M donor only samples. ***, p = 1.3 × 10 -8 ; ***, p = 1.6 × 10 -8 ; **, p = 0.0056; *, p = 0.011; ns = 0.99; ordinary one-way ANOVA with Šídák’s post- hoc multiple comparisons test. i. CD33 MΔ4bp variant forms a stable soluble protein in cell lysates and is secreted into the media , where it may bind with the extracellular domains of CD33 M and CD33 m . There may be a similar physiological soluble CD33 protein that is either shed into the medium by CD33 M ectodomain proteolysis or is produced as an alternative splicing product. A cartoon showing the domain structures and epitope tags of CD33 M , CD33 m , CD33 Δ4bp and the putative soluble CD33 M ectodomain product (sCD33 M ) is included in . j. Western blot analysis of CD33 immunoprecipitated by the CD33 Ig-like V-set domain antibody (ab134115) from lysates and conditioned medium of iMGs . Immunoprecipitation products were probed for CD33 using the CD33 Ig-like C2-set domain antibody (PWS44). The data demonstrate the presence of fuzzy, likely glycosylated soluble CD33- immunoreactvive (sCD33) cleavage product in the medium, but not in iMG cell lysates. Notably, sCD33 increases upon stimulation of the iMG cells with 300 nM CLU (lane 5). k. Western blot of lysates and HA-immunoprecipitation products from HEK293 cells expressing CD33 M -HA, CD33 m -HA and CD33 MΔ4bp. HA-immunoprecipitation products were probed with the anti-CD33 antibody (ab134115) which recognises only epitopes in the V-set domain. Arrowheads denote CD33 derivative protein. Representative blots for n = 3 independent biological replicates. The result reveals that CD33 MΔ4bp co-precipitates with CD33 M and CD33 m . These studies do not distinguish whether this interaction occurs in the intracellular compartment or whether they occur at the cell surface.

    Techniques Used: Ligand Binding Assay, Expressing, Flow Cytometry, Mutagenesis, Fluorescence, Staining, Imaging, Labeling, Derivative Assay, Variant Assay, Produced, Alternative Splicing, Western Blot, Immunoprecipitation

    Sequence conservation of dimer interface residues in CD33 C2-set domains of multiple human Siglecs. This region was identified by the EPPIC program as likely to form biologically authentic dimer interfaces. Red arrows depict residues determined by EPPIC to have > 95% buried surface area in the interface, green arrows residues with > 70% buried surface area. These are highly conserved in a subset of the sequences.
    Figure Legend Snippet: Sequence conservation of dimer interface residues in CD33 C2-set domains of multiple human Siglecs. This region was identified by the EPPIC program as likely to form biologically authentic dimer interfaces. Red arrows depict residues determined by EPPIC to have > 95% buried surface area in the interface, green arrows residues with > 70% buried surface area. These are highly conserved in a subset of the sequences.

    Techniques Used: Sequencing

    Blue-Native PAGE analysis of digitonin-lysed native CD33 from fresh human peripheral blood monocytes and THP-1 cells. Western blotting with an anti-CD33 antibody demonstrates a species migrating in excess of the predicted monomeric size of 67- 75 kDa.
    Figure Legend Snippet: Blue-Native PAGE analysis of digitonin-lysed native CD33 from fresh human peripheral blood monocytes and THP-1 cells. Western blotting with an anti-CD33 antibody demonstrates a species migrating in excess of the predicted monomeric size of 67- 75 kDa.

    Techniques Used: Blue Native PAGE, Western Blot

    Mutagenesis of Phe177Ala + Trp179Ala + Leu180Ala + Arg190Ala + Gln213Ala residues within the dimer site was performed to disrupt the hydrophobic and polar interactions in the dimer site. Mutation of any combination of 1-4 of these 5 residues had no effect on dimer formation. However. mutation of all 5 residues resulted in formation of stable, fully glycosylated CD33 M and CD33 m monomers that do not co-precipitate other CD33 peptides
    Figure Legend Snippet: Mutagenesis of Phe177Ala + Trp179Ala + Leu180Ala + Arg190Ala + Gln213Ala residues within the dimer site was performed to disrupt the hydrophobic and polar interactions in the dimer site. Mutation of any combination of 1-4 of these 5 residues had no effect on dimer formation. However. mutation of all 5 residues resulted in formation of stable, fully glycosylated CD33 M and CD33 m monomers that do not co-precipitate other CD33 peptides

    Techniques Used: Mutagenesis

    a. CD33 M co-immunoprecipitates sialylated CLU, but not desialylated CLU. Endogenous human CD33 expressed on human monocytic U937 cells interact with native human plasma CLU, but not with desialylated CLU applied to the culture supernatant. The graph shows quantification of western blots of anti-CD33 co-immunoprecipitation products from cell lysates, blotted with anti-CLU antibodies. Quantification is performed by measuring the band intensities on autoradiograms of co-IP Western blots using anti-CD33 and anti-CLU antibodies to detect CD33 and coprecipitating CLU respectively. The result (CD33-bound CLU) is expressed as the ratio of CLU to CD33 band intensities as arbitrary units (a.u.). Representative western blot is shown in left panel. *** = p<0.0001; Student t-test; error bars = mean ± SEM CLU: 1.23±0.04; desCLU: 0.23 ± 0.051; n = 5 independent replications. b. CD33 M but not CD33 m co-immunoprecipitates with CLU. The graph shows quantification of CLU co-precipitating with CD33 M in HEK293 cells as measured by the band intensities on western blots of the co-immunoprecipitating products. The results are expressed as CD33-bound CLU using arbitrary units to depict the ratio of CLU band intensity relative to the CD33 band intensity. HEK293 cells expressed: CD33 M only (CD33 M/M dimers), both CD33 M and CD33 m (CD33 M/M ; CD33 M / m or CD33 m/m dimers) (CLU does not co-precipitate with CD33 in cells expressing only CD33 m/m dimers). Graph columns 3 and 4 depict the results for cells expressing both CD33 M and CD33 m . The third column shows the CLU: CD33 M ratio. The fourth column shows the CD33 bound-CLU ratio computed for total cellular CD33. The HA epitope tag on both CD33 M and CD33m is used to measure both CD33 M and CD33 m immunoreactivities (CD33 Total ). A representative blot is shown in , right panel *** = p<0.00001; two-tailed Student t- tests; error bars = mean ± SEM CD33 M : 0.85 ± 0.023; CD33m: 0.004 ± 0.00043; CD33 M / m : 0.45±0.041; n = 5 biological replications. c. Dimerization of CD33 is required for CLU binding Co-IP studies on lysates from HEK293 cells expressing similar quantities of CD33 M reveal that much less CLU is co- precipitated with the CD33 M-5X dimer interface mutant than with wild type CD33 M . The data is quantified as in panel b. A representative western blot is available in . *** p<0.00001, error bars = mean ± SEM CD33 M : 0.425 ± 0.0073; CD33 M- 5X : 0.012 ± 0.006; n = 5 replications. Each lane represents one independent biological replication of the respective condition. d. CLU binds to CD33 M ECD with nanomolar avidity via sialic acids: i. BLI curves of CLU binding to CD33 M ECD WT; ii. Desialylated-CLU showed no detectable binding to CD33 M ECD WT; iii . CD33 M ECD R119A mutant showed no detectable CLU binding. CLU concentrations are indicated. Each binding curve is the average of n = 4 independent measurements; iv . R119A mutation of the canonical sialic acid binding site disrupts CLU binding. Steady-state BLI analysis of the CLU binding to CD33 M ECD WT (yellow square) or CD33 M ECD R119A (open square) and desialylated-human CLU to CD33 M ECD WT (pink square). Curve fitting was performed using Hill equation. Equilibrium dissociation constant is 27.9 ± 7.2 nM. This result is not due to misfolding of the CD33 M R119A protein because the Far UV CD spectra of wild type and R119A proteins are similar . Error bars = SD. n = 4 independent replications; v. CLU+Aβ 1-42 showed similar binding avidity to CD33 M ectodomain with CLU alone. Steady-state BLI analysis of the CLU/Aβ 1-42 mixture binding to CD33 M ECD WT (teal square). yellow squares indicate binding responses of CLU alone to CD33 M ECD WT. Curve fitting was performed using Hill equation. Equilibrium dissociation constant of CLU/Aβ42 is 28.2 ± 4.9 nM; vi. BLI curves of CLU/Aβ 1-42 mixture binding to CD33 M ECD WT. Binding curves obtained from the same concentration of Aβ 1-42 alone was subtracted from the curve from CLU/Aβ 1-42 mixture. Each curve is the average of four independent measurements. CLU/Aβ 1-42 concentrations are indicated. Error bars = SD, n = 4 independent biological replications. e. ApoE does not bind to CD33 . Representative western blots for co-immunoprecipitation of ApoE isoforms with His-tagged CD33 and ApoER2. 20µg wild-type (WT) and mutant (R119A) CD33 proteins with or without glycosylation (G) fused to His-tag were incubated with 50µl dynabeads, followed by incubation with 500µl of ApoE3 or ApoE4 (3µg/ml). ApoE bound to CD33 and ApoER2 was detected by immunoblots using anti-ApoE antibody. Beads only and ApoER2 ectodomain with His-tag were used for negative and positive controls, respectively. N = 4 replications.
    Figure Legend Snippet: a. CD33 M co-immunoprecipitates sialylated CLU, but not desialylated CLU. Endogenous human CD33 expressed on human monocytic U937 cells interact with native human plasma CLU, but not with desialylated CLU applied to the culture supernatant. The graph shows quantification of western blots of anti-CD33 co-immunoprecipitation products from cell lysates, blotted with anti-CLU antibodies. Quantification is performed by measuring the band intensities on autoradiograms of co-IP Western blots using anti-CD33 and anti-CLU antibodies to detect CD33 and coprecipitating CLU respectively. The result (CD33-bound CLU) is expressed as the ratio of CLU to CD33 band intensities as arbitrary units (a.u.). Representative western blot is shown in left panel. *** = p<0.0001; Student t-test; error bars = mean ± SEM CLU: 1.23±0.04; desCLU: 0.23 ± 0.051; n = 5 independent replications. b. CD33 M but not CD33 m co-immunoprecipitates with CLU. The graph shows quantification of CLU co-precipitating with CD33 M in HEK293 cells as measured by the band intensities on western blots of the co-immunoprecipitating products. The results are expressed as CD33-bound CLU using arbitrary units to depict the ratio of CLU band intensity relative to the CD33 band intensity. HEK293 cells expressed: CD33 M only (CD33 M/M dimers), both CD33 M and CD33 m (CD33 M/M ; CD33 M / m or CD33 m/m dimers) (CLU does not co-precipitate with CD33 in cells expressing only CD33 m/m dimers). Graph columns 3 and 4 depict the results for cells expressing both CD33 M and CD33 m . The third column shows the CLU: CD33 M ratio. The fourth column shows the CD33 bound-CLU ratio computed for total cellular CD33. The HA epitope tag on both CD33 M and CD33m is used to measure both CD33 M and CD33 m immunoreactivities (CD33 Total ). A representative blot is shown in , right panel *** = p<0.00001; two-tailed Student t- tests; error bars = mean ± SEM CD33 M : 0.85 ± 0.023; CD33m: 0.004 ± 0.00043; CD33 M / m : 0.45±0.041; n = 5 biological replications. c. Dimerization of CD33 is required for CLU binding Co-IP studies on lysates from HEK293 cells expressing similar quantities of CD33 M reveal that much less CLU is co- precipitated with the CD33 M-5X dimer interface mutant than with wild type CD33 M . The data is quantified as in panel b. A representative western blot is available in . *** p<0.00001, error bars = mean ± SEM CD33 M : 0.425 ± 0.0073; CD33 M- 5X : 0.012 ± 0.006; n = 5 replications. Each lane represents one independent biological replication of the respective condition. d. CLU binds to CD33 M ECD with nanomolar avidity via sialic acids: i. BLI curves of CLU binding to CD33 M ECD WT; ii. Desialylated-CLU showed no detectable binding to CD33 M ECD WT; iii . CD33 M ECD R119A mutant showed no detectable CLU binding. CLU concentrations are indicated. Each binding curve is the average of n = 4 independent measurements; iv . R119A mutation of the canonical sialic acid binding site disrupts CLU binding. Steady-state BLI analysis of the CLU binding to CD33 M ECD WT (yellow square) or CD33 M ECD R119A (open square) and desialylated-human CLU to CD33 M ECD WT (pink square). Curve fitting was performed using Hill equation. Equilibrium dissociation constant is 27.9 ± 7.2 nM. This result is not due to misfolding of the CD33 M R119A protein because the Far UV CD spectra of wild type and R119A proteins are similar . Error bars = SD. n = 4 independent replications; v. CLU+Aβ 1-42 showed similar binding avidity to CD33 M ectodomain with CLU alone. Steady-state BLI analysis of the CLU/Aβ 1-42 mixture binding to CD33 M ECD WT (teal square). yellow squares indicate binding responses of CLU alone to CD33 M ECD WT. Curve fitting was performed using Hill equation. Equilibrium dissociation constant of CLU/Aβ42 is 28.2 ± 4.9 nM; vi. BLI curves of CLU/Aβ 1-42 mixture binding to CD33 M ECD WT. Binding curves obtained from the same concentration of Aβ 1-42 alone was subtracted from the curve from CLU/Aβ 1-42 mixture. Each curve is the average of four independent measurements. CLU/Aβ 1-42 concentrations are indicated. Error bars = SD, n = 4 independent biological replications. e. ApoE does not bind to CD33 . Representative western blots for co-immunoprecipitation of ApoE isoforms with His-tagged CD33 and ApoER2. 20µg wild-type (WT) and mutant (R119A) CD33 proteins with or without glycosylation (G) fused to His-tag were incubated with 50µl dynabeads, followed by incubation with 500µl of ApoE3 or ApoE4 (3µg/ml). ApoE bound to CD33 and ApoER2 was detected by immunoblots using anti-ApoE antibody. Beads only and ApoER2 ectodomain with His-tag were used for negative and positive controls, respectively. N = 4 replications.

    Techniques Used: Clinical Proteomics, Western Blot, Immunoprecipitation, Co-Immunoprecipitation Assay, Expressing, Two Tailed Test, Binding Assay, Mutagenesis, Circular Dichroism, Concentration Assay, Glycoproteomics, Incubation

    SEC-MALS demonstrates CD33 ECD dimers in solution Left Panel - SEC-MALS analysis of Endo H f -trimmed CD33 ECD. Shown are plots of refractive index (RI, right axis) and evaluated molar mass (left axis) against elution volume for samples loaded at 2.5 mg/ml (blue) and 0.5 mg/ml (red). The glycan-trimmed sample were considered as all protein but still analysed using either UV and RI as concentration signals. At the higher concentration (∼ 10 µM on column), RI indicates a mass of 47 kDa over the central 50 % of the peak while analysis using UV absorbance as the concentration source gives a mass of 50 kDa. These results confirm that CD33 ECD is present predominantly as a dimer in solution at the concentrations achieved over the central 50% of the SEC peak (∼ 5-10 µM). At the lower concentration loaded (∼ 2 µM on column) the apparent mass is slightly lower at 41 kDa and 44kDa (RI, UV). Consequently we can estimate that the Kd for this dimerisation is much below µM and probably on the order of 100s of nM. Right Panel - SEC-MALS of fully glycosylated CD33 ECD. As for the trimmed sample, protein was loaded at 2.5 mg/ml (blue) and 0.5 mg/ml (red). The glycosylated samples eluted overall earlier than the Endo H- trimmed samples consistent with a higher expected mass and larger hydrodynamic properties contributed by the additional carbohydrate. Due to the significant contribution of glycans to the mass of the system, a dual concentration conjugate analysis was applied ( dn/dc protein 0.1885 ml g -1 , dn/dc carbohydrate 0.145 ml g -1 , UV protein 1252 ml g -1 cm -1 , UV carbohydrate no absorbance). This analysis evaluates a protein mass of about 43 kDa (symbol +) and a carbohydrate mass of about 18 kDa (symbol X) consistent with dimer formation and with the predicted mass of the carbohydrate modifications on CD33 giving a total mass around 60 kDa (symbol filled square). Bottom Panel - QELS measurements (DLS) made for the SEC-MALS samples injected at 2.5 mg/ml. The hydrodynamic radius calculated for glycosylated CD33 ECD (black) of 3.5 nm is larger than expected for a 50kDa dimeric protein (for example, larger than that of the BSA standard (green) which is a 66 kDa protein) consistent with the presence of the extensive carbohydrate modifications GlcNAc 2 Man 9 at 5 positions. Endo H f -trimmed CD33 ECD (blue) has an Rh of 3.0 nm, which is more consistent with a simple globular protein of 50 kDa mass as expected following the almost complete removal of its carbohydrate adducts.
    Figure Legend Snippet: SEC-MALS demonstrates CD33 ECD dimers in solution Left Panel - SEC-MALS analysis of Endo H f -trimmed CD33 ECD. Shown are plots of refractive index (RI, right axis) and evaluated molar mass (left axis) against elution volume for samples loaded at 2.5 mg/ml (blue) and 0.5 mg/ml (red). The glycan-trimmed sample were considered as all protein but still analysed using either UV and RI as concentration signals. At the higher concentration (∼ 10 µM on column), RI indicates a mass of 47 kDa over the central 50 % of the peak while analysis using UV absorbance as the concentration source gives a mass of 50 kDa. These results confirm that CD33 ECD is present predominantly as a dimer in solution at the concentrations achieved over the central 50% of the SEC peak (∼ 5-10 µM). At the lower concentration loaded (∼ 2 µM on column) the apparent mass is slightly lower at 41 kDa and 44kDa (RI, UV). Consequently we can estimate that the Kd for this dimerisation is much below µM and probably on the order of 100s of nM. Right Panel - SEC-MALS of fully glycosylated CD33 ECD. As for the trimmed sample, protein was loaded at 2.5 mg/ml (blue) and 0.5 mg/ml (red). The glycosylated samples eluted overall earlier than the Endo H- trimmed samples consistent with a higher expected mass and larger hydrodynamic properties contributed by the additional carbohydrate. Due to the significant contribution of glycans to the mass of the system, a dual concentration conjugate analysis was applied ( dn/dc protein 0.1885 ml g -1 , dn/dc carbohydrate 0.145 ml g -1 , UV protein 1252 ml g -1 cm -1 , UV carbohydrate no absorbance). This analysis evaluates a protein mass of about 43 kDa (symbol +) and a carbohydrate mass of about 18 kDa (symbol X) consistent with dimer formation and with the predicted mass of the carbohydrate modifications on CD33 giving a total mass around 60 kDa (symbol filled square). Bottom Panel - QELS measurements (DLS) made for the SEC-MALS samples injected at 2.5 mg/ml. The hydrodynamic radius calculated for glycosylated CD33 ECD (black) of 3.5 nm is larger than expected for a 50kDa dimeric protein (for example, larger than that of the BSA standard (green) which is a 66 kDa protein) consistent with the presence of the extensive carbohydrate modifications GlcNAc 2 Man 9 at 5 positions. Endo H f -trimmed CD33 ECD (blue) has an Rh of 3.0 nm, which is more consistent with a simple globular protein of 50 kDa mass as expected following the almost complete removal of its carbohydrate adducts.

    Techniques Used: Refractive Index, Glycoproteomics, Concentration Assay, Injection

    Flow cytometry analysis by double staining on CD33 M /CD33 M , CD33 m /CD33 m or CD33 M /CD33 m transfected cells using antibodies specific to CD33 M (WM53) and CD33 m (A16121H) respectively. Mean Fluorescence Intensities (MFIs) of cells expressing CD33 M (upper) and CD33 m (lower) were quantified. Error bars represent SEM. Statistical analysis was performed using one-way ANOVA followed by Tukey’s test (n = 6, in 3 independent experiments, *** p .<0.001 vs M/m).
    Figure Legend Snippet: Flow cytometry analysis by double staining on CD33 M /CD33 M , CD33 m /CD33 m or CD33 M /CD33 m transfected cells using antibodies specific to CD33 M (WM53) and CD33 m (A16121H) respectively. Mean Fluorescence Intensities (MFIs) of cells expressing CD33 M (upper) and CD33 m (lower) were quantified. Error bars represent SEM. Statistical analysis was performed using one-way ANOVA followed by Tukey’s test (n = 6, in 3 independent experiments, *** p .<0.001 vs M/m).

    Techniques Used: Flow Cytometry, Double Staining, Transfection, Fluorescence, Expressing

    Extended Data Figure 1K: Quantification of the surface density and diffusion states of labeled CD33 receptor samples. A , Surface densities prior to smFRET imaging of donor and acceptor labeled samples for smFRET studies. Dots represent the number of acceptor (nAcc) or donor (nDon) particles per area for the indicated number of single cells ( n cells) collected over 4 independent experiments for the CD33M and CD33m samples, and 3 independent experiments for the CD33M-5X and CD33M donor only samples. Box plot details are described in the legend of . The median density of total labeled (acceptor + donor) receptors ranged from 0.34 – 0.60 molecules/μm 2 . The median density of the donor only labeled CD33M sample was 0.22 molecules/μm 2 and near zero acceptors detected as expected. B , Total fraction of time spent in the immobile, confined, free, and directed diffusion states assigned by DC-MSS. Dots represent individual cell means and the middle and upper/lower lines depict the overall mean (values shown) and standard deviation, respectively, for 32 cells for the CD33M sample and 34 cells for the CD33m sample collected over 4 independent experiments.
    Figure Legend Snippet: Extended Data Figure 1K: Quantification of the surface density and diffusion states of labeled CD33 receptor samples. A , Surface densities prior to smFRET imaging of donor and acceptor labeled samples for smFRET studies. Dots represent the number of acceptor (nAcc) or donor (nDon) particles per area for the indicated number of single cells ( n cells) collected over 4 independent experiments for the CD33M and CD33m samples, and 3 independent experiments for the CD33M-5X and CD33M donor only samples. Box plot details are described in the legend of . The median density of total labeled (acceptor + donor) receptors ranged from 0.34 – 0.60 molecules/μm 2 . The median density of the donor only labeled CD33M sample was 0.22 molecules/μm 2 and near zero acceptors detected as expected. B , Total fraction of time spent in the immobile, confined, free, and directed diffusion states assigned by DC-MSS. Dots represent individual cell means and the middle and upper/lower lines depict the overall mean (values shown) and standard deviation, respectively, for 32 cells for the CD33M sample and 34 cells for the CD33m sample collected over 4 independent experiments.

    Techniques Used: Diffusion-based Assay, Labeling, Imaging, Standard Deviation

    A broad-spectrum sheddase inhibitor, batimastat could reduce soluble CD33 in iMG conditioned medium . Differentiated iMGs were treated with 5 µM batimastat for 24 hours. Conditioned media was collected, centrifuged at 14,000 rpm for 10 minutes at 4°C. sCD33 were measured by ELISA (Abcam, ab283542) following the manufacturer’s protocol. Three independent wells of each treatments were collected, and all samples were assayed in duplicates. Statistical analysis was performed using paired t-test, p=0.0134.
    Figure Legend Snippet: A broad-spectrum sheddase inhibitor, batimastat could reduce soluble CD33 in iMG conditioned medium . Differentiated iMGs were treated with 5 µM batimastat for 24 hours. Conditioned media was collected, centrifuged at 14,000 rpm for 10 minutes at 4°C. sCD33 were measured by ELISA (Abcam, ab283542) following the manufacturer’s protocol. Three independent wells of each treatments were collected, and all samples were assayed in duplicates. Statistical analysis was performed using paired t-test, p=0.0134.

    Techniques Used: Enzyme-linked Immunosorbent Assay

    Cartoons depicting: Left : the putative secretion of CD33 MΔ4BP and putative endoproteolytic shedding of sCD33 M , and the tagging and western blot strategy used here. The scissor cartoon depicts the site of a putative endoproteolytic cleavage or splice site that generates the endogenous soluble CD33 M ectodomain. Right : the putative binding of CD33 MΔ4BP (or speculatively sCD33 M ) to the extracellular domains of CD33 M or CD33 m . The CD33 MΔ4BP :CD33 M binding site is not defined., but could potentially recreate a dimeric ligand pocket with CD33 M monomers, and a monomeric ligand pocket with CD33 m .
    Figure Legend Snippet: Cartoons depicting: Left : the putative secretion of CD33 MΔ4BP and putative endoproteolytic shedding of sCD33 M , and the tagging and western blot strategy used here. The scissor cartoon depicts the site of a putative endoproteolytic cleavage or splice site that generates the endogenous soluble CD33 M ectodomain. Right : the putative binding of CD33 MΔ4BP (or speculatively sCD33 M ) to the extracellular domains of CD33 M or CD33 m . The CD33 MΔ4BP :CD33 M binding site is not defined., but could potentially recreate a dimeric ligand pocket with CD33 M monomers, and a monomeric ligand pocket with CD33 m .

    Techniques Used: Western Blot, Binding Assay

    Left : endogenous CD33 M co-immunoprecipitates sialylated CLU, but not desialylated CLU in U937 cells. Representative western blot for . Top blot : representative western blots of anti-CD33 co-immunoprecipitation products, blotted with anti- CLU antibodies. Lower blot : anti-CD33 co-immunoprecipitation products probed with anti-CD33 antibody, showing equivalent pulldown. This data is quantified in , left panel. Each lane shown represents one independent biological replication of the respective condition. Right : exogenous CD33 M but not CD33 m co-immunoprecipitates with CLU in HEK293 cells. Representative western blot for . Top panel: Representative western blots showing co-precipitation of CLU with CD33 M in HEK293 cells expressing CD33 M only (CD33 M /CD33 M dimers), or in HEK293 cells expressing both CD33 M and CD33 m (CD33 M /CD33 M ; CD33 M /C D33 m or CD33 m /CD33 m dimers) (CLU does not co-precipitate with CD33 in cells expressing only CD33 m ). Top blot : anti-HA pulldown probed with anti-CLU antibody. Middle blot : same IP products probed with anti-HA antibody. Lower blot : Protein input before precipitation probed with anti-CD33 antibody. This data is quantified in . In , the data for HEK293 cells expressing both CD33M and CD33m is displayed in the third column is the ratio of CLU immunoreactive band intensities versus just the CD33M band intensity. In the fourth column, the same CLU immunoreactive band intensity is expressed as the ratio of the cumulative band intensities as measured by HA immunoreactivity for both CD33m and CD33M isoforms.Each lane shown represents one independent biological replication of the respective condition.
    Figure Legend Snippet: Left : endogenous CD33 M co-immunoprecipitates sialylated CLU, but not desialylated CLU in U937 cells. Representative western blot for . Top blot : representative western blots of anti-CD33 co-immunoprecipitation products, blotted with anti- CLU antibodies. Lower blot : anti-CD33 co-immunoprecipitation products probed with anti-CD33 antibody, showing equivalent pulldown. This data is quantified in , left panel. Each lane shown represents one independent biological replication of the respective condition. Right : exogenous CD33 M but not CD33 m co-immunoprecipitates with CLU in HEK293 cells. Representative western blot for . Top panel: Representative western blots showing co-precipitation of CLU with CD33 M in HEK293 cells expressing CD33 M only (CD33 M /CD33 M dimers), or in HEK293 cells expressing both CD33 M and CD33 m (CD33 M /CD33 M ; CD33 M /C D33 m or CD33 m /CD33 m dimers) (CLU does not co-precipitate with CD33 in cells expressing only CD33 m ). Top blot : anti-HA pulldown probed with anti-CLU antibody. Middle blot : same IP products probed with anti-HA antibody. Lower blot : Protein input before precipitation probed with anti-CD33 antibody. This data is quantified in . In , the data for HEK293 cells expressing both CD33M and CD33m is displayed in the third column is the ratio of CLU immunoreactive band intensities versus just the CD33M band intensity. In the fourth column, the same CLU immunoreactive band intensity is expressed as the ratio of the cumulative band intensities as measured by HA immunoreactivity for both CD33m and CD33M isoforms.Each lane shown represents one independent biological replication of the respective condition.

    Techniques Used: Western Blot, Immunoprecipitation, Expressing

    Co-IP studies on lysates from HEK293 cells expressing similar quantities of CD33 M ( bottom panel ) reveal that much less CLU ( top panel ) is co-precipitated with the CD33 M 5X dimer interface mutant than with wild type CD33 M . This is a representative blot for data for multiple biologica; replicates and is quantified in . Each lane shown represents one independent biological replication of the respective condition
    Figure Legend Snippet: Co-IP studies on lysates from HEK293 cells expressing similar quantities of CD33 M ( bottom panel ) reveal that much less CLU ( top panel ) is co-precipitated with the CD33 M 5X dimer interface mutant than with wild type CD33 M . This is a representative blot for data for multiple biologica; replicates and is quantified in . Each lane shown represents one independent biological replication of the respective condition

    Techniques Used: Co-Immunoprecipitation Assay, Expressing, Mutagenesis

    BLI response curves representing the association (0-60 s) and dissociation (60-90 s) of CD33 M ectodomain (ECD) WT (left panel) or R119A (right panel) in the concentration range of 15.6-250 µM with the 3’-sialyllactose-sp-biotin immobilized on the Super Streptavidin biosensors. Binding curves analysis using a 1:2 bivalent analyte model revealed that the dimer of CD33 M ECD WT binds to 3’-syalyllactose with dissociation constants 6.13 ± 0.25 mM (mean ± SEM). CD33 M ECD R119A showed no detectable binding in the same concentration range with WT.
    Figure Legend Snippet: BLI response curves representing the association (0-60 s) and dissociation (60-90 s) of CD33 M ectodomain (ECD) WT (left panel) or R119A (right panel) in the concentration range of 15.6-250 µM with the 3’-sialyllactose-sp-biotin immobilized on the Super Streptavidin biosensors. Binding curves analysis using a 1:2 bivalent analyte model revealed that the dimer of CD33 M ECD WT binds to 3’-syalyllactose with dissociation constants 6.13 ± 0.25 mM (mean ± SEM). CD33 M ECD R119A showed no detectable binding in the same concentration range with WT.

    Techniques Used: Concentration Assay, Binding Assay

    Binding analysis by microscale thermophoresis measuring the change in the fluorescence intensity of fluorescently labeled deglycosylated CD33 ECD (initial fluorescence)
    Figure Legend Snippet: Binding analysis by microscale thermophoresis measuring the change in the fluorescence intensity of fluorescently labeled deglycosylated CD33 ECD (initial fluorescence)

    Techniques Used: Binding Assay, Microscale Thermophoresis, Fluorescence, Labeling

    Far UV circular dichroism spectra for wild type CD33 M ectodomain (black) and R119A mutant CD33 M ectodomain (red) reveal similar folding states, indicating that the loss of sialic acid binding by the R119A protein is due to an authentic effect on ligand binding, rather than due to simple misfolding of the R119A mutant protein.. Spectra were recorded at 4°C with CD33 ECD at 0.2 mg/ml in 20 mM HEPES, 200 mM NaCl, pH7.5.
    Figure Legend Snippet: Far UV circular dichroism spectra for wild type CD33 M ectodomain (black) and R119A mutant CD33 M ectodomain (red) reveal similar folding states, indicating that the loss of sialic acid binding by the R119A protein is due to an authentic effect on ligand binding, rather than due to simple misfolding of the R119A mutant protein.. Spectra were recorded at 4°C with CD33 ECD at 0.2 mg/ml in 20 mM HEPES, 200 mM NaCl, pH7.5.

    Techniques Used: Circular Dichroism, Mutagenesis, Binding Assay, Ligand Binding Assay

    a. In situ Proximity ligation assay for CD33-bound CLU on IBA-1 positive microglial cells in post-mortem human AD brain . Representative confocal microscopy images showing CD33:CLU PLA signals in microglia close to amyloid plaques in human AD brain cortex (63x, scale bar = 50 µm). An enlarged view of the PLA signal is shown in the upper right panel. FFPE sections were stained for 6E10 Aβ = violet; IBA1 microglia = green; PLA = red; and DAPI nucleus = blue. b. Dot plot showing In vivo correlations between microglial CD33:CLU PLA signal intensity and the distance of the microglial cell from Aβ plaque. The proportion of CD33-CLU positive pixels for each IBA-1 positive microglial cell was plotted relative to the distance of that cell from the edge of Aβ plaque (r 2 = 0.6235). There was a negative correlation between distance from the plaque edge and the proportion of CD33-CLU PLA positive pixels in microglia in human AD brain (spearman r = -0.739, p < 0.0001, n = 29 microglia from n = 2 independent AD affected brains). c. More endogenous CLU can be co-immunoprecipitated with endogenous CD33 from human AD brain than from control brain. The graph shows quantification of CLU:CD33 co-immunoprecipitation (CD33-bound CLU) in brain lysates from AD cases (n = 3), but only weak CLU:CD33 co-immunoprecipitation is seen in brain lysates from control cases (n = 3). Representative co-IP western blot of lysates and anti-CD33 co-immunoprecipitation products probed with anti-CLU antibodies is observed in . *** = p < 0.001; ANOVA; error bars = mean ± SEM; n = 3 independent samples. Because both CLU and CD33 levels are highly variable in post-mortem tissue, brains were selected based on equal expression levels of both CLU and CD33 from a panel of n=53 control and AD cerebral cortices. d. Native human CLU (either alone or complexed with Aβ1-42 oligomers) also binds exogenous human CD33 M on transfected HEK293 cells. The graph shows quantification of CLU:CD33 co-IP products (CD33-bound CLU). A representative co-IP western blot is shown in , right panel. There is no significant difference in the amount of CLU bound to CD33M in lysates from HEK293 cells expressing exogenous CD33M and exposed to CLU alone versus CLU plus Aβ oligomers. NS = not significant; Student t-test; error bars = mean ± SEM CLU: 1.145± 0.0904; CLU+Aβ1-42: 1.379± 0.0798; n = 3. Each dot represents one independent biological replication of the respective condition e. Native human CLU (either alone or complexed with Aβ1-42 oligomers) also binds endogenous human CD33 M physiologically expressed on U937 cells . Representative co-IP western blot is shown in , left panel. There is no significant difference in the amount of CD33-bound CLU in lysates from U937 cells exposed to CLU alone versus CLU plus Aβ oligomers NS = not significant; Student t-test; error bars = mean ± SEM; CLU: 0.928± 0.06; CLU+Aβ1-42: 0.881± 0.0491; n = 6. Each dot represents one independent biological replication of the respective condition.
    Figure Legend Snippet: a. In situ Proximity ligation assay for CD33-bound CLU on IBA-1 positive microglial cells in post-mortem human AD brain . Representative confocal microscopy images showing CD33:CLU PLA signals in microglia close to amyloid plaques in human AD brain cortex (63x, scale bar = 50 µm). An enlarged view of the PLA signal is shown in the upper right panel. FFPE sections were stained for 6E10 Aβ = violet; IBA1 microglia = green; PLA = red; and DAPI nucleus = blue. b. Dot plot showing In vivo correlations between microglial CD33:CLU PLA signal intensity and the distance of the microglial cell from Aβ plaque. The proportion of CD33-CLU positive pixels for each IBA-1 positive microglial cell was plotted relative to the distance of that cell from the edge of Aβ plaque (r 2 = 0.6235). There was a negative correlation between distance from the plaque edge and the proportion of CD33-CLU PLA positive pixels in microglia in human AD brain (spearman r = -0.739, p < 0.0001, n = 29 microglia from n = 2 independent AD affected brains). c. More endogenous CLU can be co-immunoprecipitated with endogenous CD33 from human AD brain than from control brain. The graph shows quantification of CLU:CD33 co-immunoprecipitation (CD33-bound CLU) in brain lysates from AD cases (n = 3), but only weak CLU:CD33 co-immunoprecipitation is seen in brain lysates from control cases (n = 3). Representative co-IP western blot of lysates and anti-CD33 co-immunoprecipitation products probed with anti-CLU antibodies is observed in . *** = p < 0.001; ANOVA; error bars = mean ± SEM; n = 3 independent samples. Because both CLU and CD33 levels are highly variable in post-mortem tissue, brains were selected based on equal expression levels of both CLU and CD33 from a panel of n=53 control and AD cerebral cortices. d. Native human CLU (either alone or complexed with Aβ1-42 oligomers) also binds exogenous human CD33 M on transfected HEK293 cells. The graph shows quantification of CLU:CD33 co-IP products (CD33-bound CLU). A representative co-IP western blot is shown in , right panel. There is no significant difference in the amount of CLU bound to CD33M in lysates from HEK293 cells expressing exogenous CD33M and exposed to CLU alone versus CLU plus Aβ oligomers. NS = not significant; Student t-test; error bars = mean ± SEM CLU: 1.145± 0.0904; CLU+Aβ1-42: 1.379± 0.0798; n = 3. Each dot represents one independent biological replication of the respective condition e. Native human CLU (either alone or complexed with Aβ1-42 oligomers) also binds endogenous human CD33 M physiologically expressed on U937 cells . Representative co-IP western blot is shown in , left panel. There is no significant difference in the amount of CD33-bound CLU in lysates from U937 cells exposed to CLU alone versus CLU plus Aβ oligomers NS = not significant; Student t-test; error bars = mean ± SEM; CLU: 0.928± 0.06; CLU+Aβ1-42: 0.881± 0.0491; n = 6. Each dot represents one independent biological replication of the respective condition.

    Techniques Used: In Situ, Proximity Ligation Assay, Confocal Microscopy, Staining, In Vivo, Immunoprecipitation, Control, Co-Immunoprecipitation Assay, Western Blot, Expressing, Transfection

    Representative Western blot for . Co-IP studies on lysates from HEK293 cells expressing similar quantities of CD33 M ( bottom panel ) reveal that much less CLU ( top panel ) is co-precipitated with the CD33 M 5X dimer interface mutant than with wild type CD33 M . This data is quantified in Extended Data Figure 3D. Right panel; quantification. *** p<0.00001, error bars = mean ± SEM CD33 M : 0.425±0.0073; CD33 M 5X: 0.012±0.006; n = 5 replications. Each lane represents one independent biological replication of the respective condition.
    Figure Legend Snippet: Representative Western blot for . Co-IP studies on lysates from HEK293 cells expressing similar quantities of CD33 M ( bottom panel ) reveal that much less CLU ( top panel ) is co-precipitated with the CD33 M 5X dimer interface mutant than with wild type CD33 M . This data is quantified in Extended Data Figure 3D. Right panel; quantification. *** p<0.00001, error bars = mean ± SEM CD33 M : 0.425±0.0073; CD33 M 5X: 0.012±0.006; n = 5 replications. Each lane represents one independent biological replication of the respective condition.

    Techniques Used: Western Blot, Co-Immunoprecipitation Assay, Expressing, Mutagenesis

    A. Binding curves of clusterin/Aβ42 mixture (left panel) or Aβ42 (right panel). Each binding curve is the average of four independent measurements. Clusterin and Aβ42 concentrations are indicated. B. Steady-state BLI analysis of the clusterin/Aβ42 mixture (red square) or Aβ42 (blue diamond) binding to CD33 M ECD. Error bars represent SD. C. The bar chart of each data point presented in B. Error bars represent SD. Statistical analysis was performed using two-way ANOVA followed by Bonferroni’s multiple comparison test (n = 4, * p <0.05, ** p <0.01 vs clusterin alone).
    Figure Legend Snippet: A. Binding curves of clusterin/Aβ42 mixture (left panel) or Aβ42 (right panel). Each binding curve is the average of four independent measurements. Clusterin and Aβ42 concentrations are indicated. B. Steady-state BLI analysis of the clusterin/Aβ42 mixture (red square) or Aβ42 (blue diamond) binding to CD33 M ECD. Error bars represent SD. C. The bar chart of each data point presented in B. Error bars represent SD. Statistical analysis was performed using two-way ANOVA followed by Bonferroni’s multiple comparison test (n = 4, * p <0.05, ** p <0.01 vs clusterin alone).

    Techniques Used: Binding Assay, Comparison

    a. Human plasma CLU alone, and especially human CLU + Aβ oligomers induce ITIM tyrosine phosphorylation of endogenous CD33 (left panel) and recruitment of endogenous SHP-1 (right panel) in human monocytic U937 cells. Quantification of CD33 phosphotyrosine (pY20 antibody immunoreactive anti-CD33 IP products) and of SHP-1 recruitment (anti-SHP-1 immunoreactive anti-CD33 IP products) using band intensity (representative blots are in . * = p <0.05; *** = p <0.001; NS = not significant; ANOVA with Tukey post-hoc correction; error bars = mean ± SEM; For CD33 M -pTyr, No treatment: 1.00±0.0; Aβ treatment: 1.367±0.4107; CLU treatment: 6.283±1.667; CLU + Aβ treatment: 11.92±1.116; For SHP-1, No treatment: 1.00±0.0; Aβ treatment: 1.447±0.2726; CLU treatment: 2.589±0.0688; CLU + Aβ treatment: 4.362±0.5971, n ≥ 3 independent biological replications. b. Recombinant human clusterin (rCLU) and native human plasma clusterin (pCLU), but not desialylated clusterin (desCLU) equivalently activate CD33 ITIM phosphorylation and SHP-1 recruitment in HEK293 cells . CD33 tyrosine phosphorylation and SHP-1 recruitment were measured by western blots band intensity ratios for pY20-phosphotyrosine immunoreactive CD33 versus total CD33 by co-IP western blots. with different cell lines are available in . c. CLU + Aβ induces greater CD33 ITIM phosphorylation than CLU alone, but only in CD33M expressing cells. Quantification of western blots of anti-CD33 immunoprecipitates probed with pY20 anti-phosphotyrosine or anti-HA antibodies reveals that treatment with CLU alone, and especially treatment with CLU + Aβ oligomers, increases CD33 tyrosine phosphorylation in cells expressing either CD33M only or CD33 M plus CD33 m . No CD33 phosphorylation was observed in cells expressing only CD33 m , and very little in CD33 M-5X cells. n = 3 replications. Representative western blots are in . d. CLU + Aβ induces greater CD33 SHP-1 recruitment than CLU alone, but only in CD33M expressing cells. Quantification of western blots of anti-CD33 immunoprecipitates probed with SHP-1 or anti-HA antibodies reveals that treatment with CLU alone, and especially treatment with CLU + Aβ oligomers, increases SHP-1 recruitment in cells expressing either CD33M only or CD33 M plus CD33 m . No SHP-1 recruitment was observed in cells expressing only CD33 m , and very little in CD33 M-5X cells. n = 3 replications. Representative western blots are in . e. Treatment of human monocytes with 0.06 µM CLU for 15 min at 37°C increases binding of CD33 and SHP-1. Human monocytes (genotype CD33 rs3865444 CC ) were treated with CLU and then a proximity ligation assay (PLA) was performed to examine CD33-SHP-1 interaction. Median fluorescence intensity of the PLA of CD33-SHP-1 was measured and analyzed in relation to untreated monocytes from the same individuals. Data were analyzed using paired t-test on GraphPad Prism. *, p<0.05. f. CD33 rs3865444 CC risk genotype-dependent effect of CLUon monomeric Aβ1-42 uptake by human monocytes. Human monocytes (genotype CD33 rs3865444 CC ) were treated with either CLU or desCLU, and the effect on Aβ1-42 uptake was assessed by flow cytometry. CLU significantly reduces the Aβ 1-42 uptake compared to the media control or desCLU treatment. Data were analyzed using geometric mean intensity of HiLyte™ Fluor 647 conjugated Aβ 1-42, n = 10 unrelated donors each examined once. Each dot represents an individual donor. Data were analyzed using ANOVA on GraphPad Prism. **, p<0.01; *, p<0.05.
    Figure Legend Snippet: a. Human plasma CLU alone, and especially human CLU + Aβ oligomers induce ITIM tyrosine phosphorylation of endogenous CD33 (left panel) and recruitment of endogenous SHP-1 (right panel) in human monocytic U937 cells. Quantification of CD33 phosphotyrosine (pY20 antibody immunoreactive anti-CD33 IP products) and of SHP-1 recruitment (anti-SHP-1 immunoreactive anti-CD33 IP products) using band intensity (representative blots are in . * = p <0.05; *** = p <0.001; NS = not significant; ANOVA with Tukey post-hoc correction; error bars = mean ± SEM; For CD33 M -pTyr, No treatment: 1.00±0.0; Aβ treatment: 1.367±0.4107; CLU treatment: 6.283±1.667; CLU + Aβ treatment: 11.92±1.116; For SHP-1, No treatment: 1.00±0.0; Aβ treatment: 1.447±0.2726; CLU treatment: 2.589±0.0688; CLU + Aβ treatment: 4.362±0.5971, n ≥ 3 independent biological replications. b. Recombinant human clusterin (rCLU) and native human plasma clusterin (pCLU), but not desialylated clusterin (desCLU) equivalently activate CD33 ITIM phosphorylation and SHP-1 recruitment in HEK293 cells . CD33 tyrosine phosphorylation and SHP-1 recruitment were measured by western blots band intensity ratios for pY20-phosphotyrosine immunoreactive CD33 versus total CD33 by co-IP western blots. with different cell lines are available in . c. CLU + Aβ induces greater CD33 ITIM phosphorylation than CLU alone, but only in CD33M expressing cells. Quantification of western blots of anti-CD33 immunoprecipitates probed with pY20 anti-phosphotyrosine or anti-HA antibodies reveals that treatment with CLU alone, and especially treatment with CLU + Aβ oligomers, increases CD33 tyrosine phosphorylation in cells expressing either CD33M only or CD33 M plus CD33 m . No CD33 phosphorylation was observed in cells expressing only CD33 m , and very little in CD33 M-5X cells. n = 3 replications. Representative western blots are in . d. CLU + Aβ induces greater CD33 SHP-1 recruitment than CLU alone, but only in CD33M expressing cells. Quantification of western blots of anti-CD33 immunoprecipitates probed with SHP-1 or anti-HA antibodies reveals that treatment with CLU alone, and especially treatment with CLU + Aβ oligomers, increases SHP-1 recruitment in cells expressing either CD33M only or CD33 M plus CD33 m . No SHP-1 recruitment was observed in cells expressing only CD33 m , and very little in CD33 M-5X cells. n = 3 replications. Representative western blots are in . e. Treatment of human monocytes with 0.06 µM CLU for 15 min at 37°C increases binding of CD33 and SHP-1. Human monocytes (genotype CD33 rs3865444 CC ) were treated with CLU and then a proximity ligation assay (PLA) was performed to examine CD33-SHP-1 interaction. Median fluorescence intensity of the PLA of CD33-SHP-1 was measured and analyzed in relation to untreated monocytes from the same individuals. Data were analyzed using paired t-test on GraphPad Prism. *, p<0.05. f. CD33 rs3865444 CC risk genotype-dependent effect of CLUon monomeric Aβ1-42 uptake by human monocytes. Human monocytes (genotype CD33 rs3865444 CC ) were treated with either CLU or desCLU, and the effect on Aβ1-42 uptake was assessed by flow cytometry. CLU significantly reduces the Aβ 1-42 uptake compared to the media control or desCLU treatment. Data were analyzed using geometric mean intensity of HiLyte™ Fluor 647 conjugated Aβ 1-42, n = 10 unrelated donors each examined once. Each dot represents an individual donor. Data were analyzed using ANOVA on GraphPad Prism. **, p<0.01; *, p<0.05.

    Techniques Used: Clinical Proteomics, Phospho-proteomics, Recombinant, Western Blot, Co-Immunoprecipitation Assay, Expressing, Binding Assay, Proximity Ligation Assay, Fluorescence, Flow Cytometry, Control

    Representative blot of n ≥ 3 independent biological replications for the graph in , showing that human plasma CLU alone, and especially human CLU + Aβ oligomers induce ITIM tyrosine phosphorylation of endogenous CD33 (top panel) and recruitment of endogenous SHP-1 (middle panel) in human monocytic U937 cells.
    Figure Legend Snippet: Representative blot of n ≥ 3 independent biological replications for the graph in , showing that human plasma CLU alone, and especially human CLU + Aβ oligomers induce ITIM tyrosine phosphorylation of endogenous CD33 (top panel) and recruitment of endogenous SHP-1 (middle panel) in human monocytic U937 cells.

    Techniques Used: Clinical Proteomics, Phospho-proteomics

    Representative western blot from n = 3 independent biological replications for . CLU + Aβ induces greater CD33 ITIM phosphorylation (top panel) and SHP-1 recruitment (bottom panel) than CLU alone, but only in CD33M expressing cells. Quantification of western blots of anti-CD33 immunoprecipitates probed with pY20 anti-phosphotyrosine, SHP-1 or anti-HA antibodies reveals that treatment with CLU alone, and especially treatment with CLU + Aβ oligomers, increases CD33 tyrosine phosphorylation and SHP-1 recruitment in cells expressing either CD33M only or CD33M plus CD33 m . No CD33 phosphorylation or SHP-1 recruitment was observed in cells expressing only CD33m, and very little in CD33M 5X cells. n = 3 replications.
    Figure Legend Snippet: Representative western blot from n = 3 independent biological replications for . CLU + Aβ induces greater CD33 ITIM phosphorylation (top panel) and SHP-1 recruitment (bottom panel) than CLU alone, but only in CD33M expressing cells. Quantification of western blots of anti-CD33 immunoprecipitates probed with pY20 anti-phosphotyrosine, SHP-1 or anti-HA antibodies reveals that treatment with CLU alone, and especially treatment with CLU + Aβ oligomers, increases CD33 tyrosine phosphorylation and SHP-1 recruitment in cells expressing either CD33M only or CD33M plus CD33 m . No CD33 phosphorylation or SHP-1 recruitment was observed in cells expressing only CD33m, and very little in CD33M 5X cells. n = 3 replications.

    Techniques Used: Western Blot, Phospho-proteomics, Expressing

    a. Compared to monocytes from human CD33 “AA” protective allele carriers, monocytes from CD33 “CC” risk allele carriers have reduced clearance of human amyloid plaques in ex vivo brain slices from 5XFAD transgenic human APP mice. Serial sections of unfixed brain from 5XFAD mice were incubated 48 hours with medium only, or with medium plus PBMCs from AA (protective) or CC (risk) allele carriers. Plaques were quantified by anti-Aβ immunofluorescent staining. The results were expressed as plaque number (i), brain area covered by plaques (ii) and plaque size (iii). The results were normalised to the results for medium only. N = 10 independent replications. ***p<0.001, *p<0.05; unpaired student’s t-test; error bars = mean ± SEM. Representative images are in . b. Human U937 monocytic cells clear amyloid plaques from ex vivo brain slices, and this is impaired by CLU. Clearance of Aβ plaques from three serial sections of unfixed 5XFAD brain was quantified by immunofluorescent staining of hippocampal Aβ plaques following 48h incubation with medium only, with U937 cells only, or U937 cells + CLU. Results are expressed as number of plaques (i) or area covered by Aβ (ii), and were normalised to the result for slices exposed to medium only. *p<0.05, **p< 0.01, ***p<0.001; unpaired student’s t-test; error bars = mean ± SEM n = 8 replications. Representative images are in . c. Compared to CLU, desCLU does not downregulate clearance of Aβ plaques by human U937 monocytic cells. Clearance of Abeta plaques was quantified by immunofluorescent staining of hippocampal Aβ plaques in three serial sections from 5XFAD brain following 48h incubation with medium only, with U937 cells plus medium containing desCLU, or with U937 cells plus medium containing CLU. Results are expressed as number of plaques (i) or area covered by Aβ (ii) and representative images are in . *p<0.05, **p<0.01, ***p<0.001, one-way ANOVA Tukey’s multiple comparisons test; error bars = mean ± SEM, n = 10 replications.
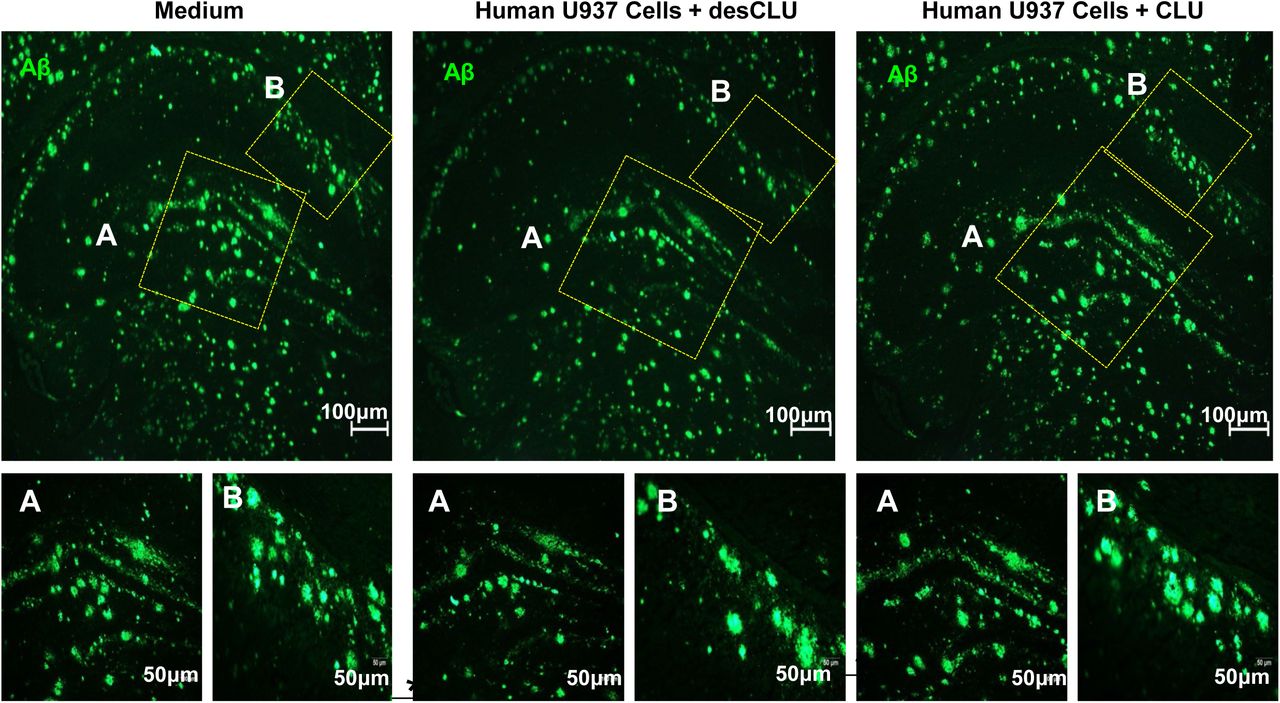
    Figure Legend Snippet: a. Compared to monocytes from human CD33 “AA” protective allele carriers, monocytes from CD33 “CC” risk allele carriers have reduced clearance of human amyloid plaques in ex vivo brain slices from 5XFAD transgenic human APP mice. Serial sections of unfixed brain from 5XFAD mice were incubated 48 hours with medium only, or with medium plus PBMCs from AA (protective) or CC (risk) allele carriers. Plaques were quantified by anti-Aβ immunofluorescent staining. The results were expressed as plaque number (i), brain area covered by plaques (ii) and plaque size (iii). The results were normalised to the results for medium only. N = 10 independent replications. ***p<0.001, *p<0.05; unpaired student’s t-test; error bars = mean ± SEM. Representative images are in . b. Human U937 monocytic cells clear amyloid plaques from ex vivo brain slices, and this is impaired by CLU. Clearance of Aβ plaques from three serial sections of unfixed 5XFAD brain was quantified by immunofluorescent staining of hippocampal Aβ plaques following 48h incubation with medium only, with U937 cells only, or U937 cells + CLU. Results are expressed as number of plaques (i) or area covered by Aβ (ii), and were normalised to the result for slices exposed to medium only. *p<0.05, **p< 0.01, ***p<0.001; unpaired student’s t-test; error bars = mean ± SEM n = 8 replications. Representative images are in . c. Compared to CLU, desCLU does not downregulate clearance of Aβ plaques by human U937 monocytic cells. Clearance of Abeta plaques was quantified by immunofluorescent staining of hippocampal Aβ plaques in three serial sections from 5XFAD brain following 48h incubation with medium only, with U937 cells plus medium containing desCLU, or with U937 cells plus medium containing CLU. Results are expressed as number of plaques (i) or area covered by Aβ (ii) and representative images are in . *p<0.05, **p<0.01, ***p<0.001, one-way ANOVA Tukey’s multiple comparisons test; error bars = mean ± SEM, n = 10 replications.

    Techniques Used: Ex Vivo, Transgenic Assay, Incubation, Staining

    Human monocytes from CD33 “CC” risk allele carriers have reduced clearance of human amyloid plaques in ex vivo brain slices compared to monocytes from CD33 “AA” protective allele carriers. Representative figures quantified in of clearance of hippocampal Aβ plaques by human monocytes following incubation on serial sections of unfixed brain from 5XFAD mice. Immunofluorescent staining of hippocampal Aβ plaques (green) following 48h incubation with medium only with no cells ( left ) or with CC (risk allele) genotype monocytes ( middle ) or with AA (protective allele) monocytes ( right ). N = 10 independent replications). DAPI blue = nuclei.
    Figure Legend Snippet: Human monocytes from CD33 “CC” risk allele carriers have reduced clearance of human amyloid plaques in ex vivo brain slices compared to monocytes from CD33 “AA” protective allele carriers. Representative figures quantified in of clearance of hippocampal Aβ plaques by human monocytes following incubation on serial sections of unfixed brain from 5XFAD mice. Immunofluorescent staining of hippocampal Aβ plaques (green) following 48h incubation with medium only with no cells ( left ) or with CC (risk allele) genotype monocytes ( middle ) or with AA (protective allele) monocytes ( right ). N = 10 independent replications). DAPI blue = nuclei.

    Techniques Used: Ex Vivo, Incubation, Staining


    Figure Legend Snippet:

    Techniques Used: Gene Expression, RNA Expression, Expressing

    Treatment of Human monocytes with 0.06 µM CLU for 15 min at 37°C increases tyrosine phosphorylation of the ITIM domain on endogenous CD33M. Quantitative western blots of lysates for human blood monocytes reveal that monocytes from homozygous carriers of the rs3865444 AA reference /non-risk allele (gray dots) express less total CD33 and less CD33M than do homozygous carriers of the rs3865444 CC risk allele (black dots) ( Left panels ). Treatment of human monocytes with 0.06 µM CLU for 15 min at 37°C increases tyrosine phosphorylation of the ITIM domain on endogenous CD33M both in individuals homozygous for the rs3865444 CC risk allele (black dots) and in individuals homozygous for the rs3865444 AA reference /non-risk allele (gray dots) paired t-test, p=0.007 (2 nd left panel). NB: As demonstrated in the left panel, carriers of the rs3865444 CC risk allele express much more CD33M than do carriers of the rs3865444 AA reference allele. However, when equal quantities of CD33M protein are loaded onto these blots to facilitate comparison of basal and CLU-induced CD33 ITIM phosphorylation, the specific activity of CD33M signaling is the same. Representative Western blots for Supplemental Figure 5F. Treatment of Human monocytes with 0.06 µM CLU for 15 min at 37°C increases tyrosine phosphorylation of the ITIM domain on endogenous CD33M. Middle panel : Quantitative western blots of lysates for human blood monocytes reveal that monocytes from homozygous carriers of the rs3865444 AA reference express less total CD33 and less CD33M than do homozygous carriers of the rs3865444 CC risk allele. Right panel : Representative western blots showing that treatment of human monocytes with 0.06 µM CLU for 15 min at 37°C increases tyrosine phosphorylation of the ITIM domain on endogenous CD33M both in individuals homozygous for the rs3865444 CC risk allele (person 2) and in individuals homozygous for the rs3865444 AA reference /nonrisk allele (person 1). Representative western blots are available in Extended Data Figure 5C-G. NB: As demonstrated in the left panel, carriers of the rs3865444 CC risk allele express much more CD33M than do carriers of the rs3865444 AA reference allele. However, when equal quantities of CD33M protein are loaded (bottom right panel) onto these blots to facilitate comparison of basal and CLU-induced CD33 ITIM phosphorylation, the specific activity of CD33M signaling is the same.
    Figure Legend Snippet: Treatment of Human monocytes with 0.06 µM CLU for 15 min at 37°C increases tyrosine phosphorylation of the ITIM domain on endogenous CD33M. Quantitative western blots of lysates for human blood monocytes reveal that monocytes from homozygous carriers of the rs3865444 AA reference /non-risk allele (gray dots) express less total CD33 and less CD33M than do homozygous carriers of the rs3865444 CC risk allele (black dots) ( Left panels ). Treatment of human monocytes with 0.06 µM CLU for 15 min at 37°C increases tyrosine phosphorylation of the ITIM domain on endogenous CD33M both in individuals homozygous for the rs3865444 CC risk allele (black dots) and in individuals homozygous for the rs3865444 AA reference /non-risk allele (gray dots) paired t-test, p=0.007 (2 nd left panel). NB: As demonstrated in the left panel, carriers of the rs3865444 CC risk allele express much more CD33M than do carriers of the rs3865444 AA reference allele. However, when equal quantities of CD33M protein are loaded onto these blots to facilitate comparison of basal and CLU-induced CD33 ITIM phosphorylation, the specific activity of CD33M signaling is the same. Representative Western blots for Supplemental Figure 5F. Treatment of Human monocytes with 0.06 µM CLU for 15 min at 37°C increases tyrosine phosphorylation of the ITIM domain on endogenous CD33M. Middle panel : Quantitative western blots of lysates for human blood monocytes reveal that monocytes from homozygous carriers of the rs3865444 AA reference express less total CD33 and less CD33M than do homozygous carriers of the rs3865444 CC risk allele. Right panel : Representative western blots showing that treatment of human monocytes with 0.06 µM CLU for 15 min at 37°C increases tyrosine phosphorylation of the ITIM domain on endogenous CD33M both in individuals homozygous for the rs3865444 CC risk allele (person 2) and in individuals homozygous for the rs3865444 AA reference /nonrisk allele (person 1). Representative western blots are available in Extended Data Figure 5C-G. NB: As demonstrated in the left panel, carriers of the rs3865444 CC risk allele express much more CD33M than do carriers of the rs3865444 AA reference allele. However, when equal quantities of CD33M protein are loaded (bottom right panel) onto these blots to facilitate comparison of basal and CLU-induced CD33 ITIM phosphorylation, the specific activity of CD33M signaling is the same.

    Techniques Used: Phospho-proteomics, Western Blot, Comparison, Activity Assay


    Similar Products

    94
    Bioss rabbit anti human cd33
    a. A schematic of <t>CD33/Siglec-3</t> long (CD33 M )( Top ), short (CD33 m ) ( Middle ) and CD33 MΔ4bp ( Bottom ) isoforms indicating signal peptide (sig pep, green), two Ig-like domains (blue, purple), transmembrane helix (red) and cytoplasmic tail (yellow). Glycosylation sites are indicated by red lollipops and disulphide bonds by black lines connecting Cys residues. b. Cartoon of the CD33 M ECD structure in two views rotated 90° about the vertical axis. The sheets in the V-set domain are green (C′CFGG′A) and blue (ABED), and the C2-set domain pink (CFG) and purple (ABED). The variable CC′ and GG′ loops are coloured purple and orange, respectively. The V-set domain is stabilised by a disulphide bond between the BBʹ loop (Cys 41) and the E strand (Cys 101). The three N -linked GlcNAc residues attached to the V-set domain (Asn100) and C2-set domain (Asn160 and 209) are shown in stick form and labelled by the amino acid to which they are linked c. A cartoon of the CD33 V-set domain structure highlighting important features for binding, and regions of difference to other siglec structures. Arg119, required for binding sialic acid, is shown in stick form (magenta). Regions of significant deviation to other siglecs are limited to the BC loop and the CC’ loop. The CC‘ loop occupies conformations varying from more open (CD33 M ) to closed (Siglec-5) over the binding site. d. Images of the ligand binding sites with bound 3′-sialyllactose. The polypeptide chain is shown in cartoon representation with the residues constituting the binding site in stick form. The sialyllactoses are shown in ball-and-stick format (carbon atoms – light blue, oxygen – red, nitrogen – dark blue) with omit mFo-DFc electron density contoured at 2 σ. The electron density maps were supportive of inclusion of sialic acid and Gal residues, but insufficient to model Glc. The CC′ loop is indicated and, in contrast to other Siglecs, makes no direct interactions with the ligands. e. Images of the ligand binding sites with bound 6′-sialyllactose.
    Rabbit Anti Human Cd33, supplied by Bioss, used in various techniques. Bioz Stars score: 94/100, based on 1 PubMed citations. ZERO BIAS - scores, article reviews, protocol conditions and more
    https://www.bioz.com/result/rabbit anti human cd33/product/Bioss
    Average 94 stars, based on 1 article reviews
    rabbit anti human cd33 - by Bioz Stars, 2026-02
    94/100 stars
      Buy from Supplier

    94
    Bioss antibody incubation
    a. CD33 M co-immunoprecipitates sialylated CLU, but not desialylated CLU. Endogenous human CD33 expressed on human monocytic U937 cells interact with native human plasma CLU, but not with desialylated CLU applied to the culture supernatant. The graph shows quantification of western blots of anti-CD33 co-immunoprecipitation products from cell lysates, blotted with anti-CLU antibodies. Quantification is performed by measuring the band intensities on autoradiograms of co-IP Western blots using anti-CD33 and anti-CLU antibodies to detect CD33 and coprecipitating CLU respectively. The result (CD33-bound CLU) is expressed as the ratio of CLU to CD33 band intensities as arbitrary units (a.u.). Representative western blot is shown in left panel. *** = p<0.0001; Student t-test; error bars = mean ± SEM CLU: 1.23±0.04; desCLU: 0.23 ± 0.051; n = 5 independent replications. b. CD33 M but not CD33 m co-immunoprecipitates with CLU. The graph shows quantification of CLU co-precipitating with CD33 M in HEK293 cells as measured by the band intensities on western blots of the co-immunoprecipitating products. The results are expressed as CD33-bound CLU using arbitrary units to depict the ratio of CLU band intensity relative to the CD33 band intensity. HEK293 cells expressed: CD33 M only (CD33 M/M dimers), both CD33 M and CD33 m (CD33 M/M ; CD33 M / m or CD33 m/m dimers) (CLU does not co-precipitate with CD33 in cells expressing only CD33 m/m dimers). Graph columns 3 and 4 depict the results for cells expressing both CD33 M and CD33 m . The third column shows the CLU: CD33 M ratio. The fourth column shows the CD33 bound-CLU ratio computed for total cellular CD33. The HA epitope tag on both CD33 M and CD33m is used to measure both CD33 M and CD33 m immunoreactivities (CD33 Total ). A representative blot is shown in , right panel *** = p<0.00001; two-tailed Student t- tests; error bars = mean ± SEM CD33 M : 0.85 ± 0.023; CD33m: 0.004 ± 0.00043; CD33 M / m : 0.45±0.041; n = 5 biological replications. c. Dimerization of CD33 is required for CLU binding Co-IP studies on lysates from HEK293 cells expressing similar quantities of CD33 M reveal that much less CLU is co- precipitated with the CD33 M-5X dimer interface mutant than with wild type CD33 M . The data is quantified as in panel b. A representative western blot is available in . *** p<0.00001, error bars = mean ± SEM CD33 M : 0.425 ± 0.0073; CD33 M- 5X : 0.012 ± 0.006; n = 5 replications. Each lane represents one independent biological replication of the respective condition. d. CLU binds to CD33 M ECD with nanomolar avidity via sialic acids: i. BLI curves of CLU binding to CD33 M ECD WT; ii. Desialylated-CLU showed no detectable binding to CD33 M ECD WT; iii . CD33 M ECD R119A mutant showed no detectable CLU binding. CLU concentrations are indicated. Each binding curve is the average of n = 4 independent measurements; iv . R119A mutation of the canonical sialic acid binding site disrupts CLU binding. Steady-state BLI analysis of the CLU binding to CD33 M ECD WT (yellow square) or CD33 M ECD R119A (open square) and desialylated-human CLU to CD33 M ECD WT (pink square). Curve fitting was performed using Hill equation. Equilibrium dissociation constant is 27.9 ± 7.2 nM. This result is not due to misfolding of the CD33 M R119A protein because the Far UV CD spectra of wild type and R119A proteins are similar . Error bars = SD. n = 4 independent replications; v. CLU+Aβ 1-42 showed similar binding avidity to CD33 M ectodomain with CLU alone. Steady-state BLI analysis of the CLU/Aβ 1-42 mixture binding to CD33 M ECD WT (teal square). yellow squares indicate binding responses of CLU alone to CD33 M ECD WT. Curve fitting was performed using Hill equation. Equilibrium dissociation constant of CLU/Aβ42 is 28.2 ± 4.9 nM; vi. BLI curves of CLU/Aβ 1-42 mixture binding to CD33 M ECD WT. Binding curves obtained from the same concentration of Aβ 1-42 alone was subtracted from the curve from CLU/Aβ 1-42 mixture. Each curve is the average of four independent measurements. CLU/Aβ 1-42 concentrations are indicated. Error bars = SD, n = 4 independent biological replications. e. ApoE does not bind to CD33 . Representative western blots for co-immunoprecipitation of ApoE isoforms with His-tagged CD33 and ApoER2. 20µg wild-type (WT) and mutant (R119A) CD33 proteins with or without glycosylation (G) fused to His-tag were incubated with 50µl dynabeads, followed by <t>incubation</t> with 500µl of ApoE3 or ApoE4 (3µg/ml). ApoE bound to CD33 and ApoER2 was detected by immunoblots using anti-ApoE antibody. Beads only and ApoER2 ectodomain with His-tag were used for negative and positive controls, respectively. N = 4 replications.
    Antibody Incubation, supplied by Bioss, used in various techniques. Bioz Stars score: 94/100, based on 1 PubMed citations. ZERO BIAS - scores, article reviews, protocol conditions and more
    https://www.bioz.com/result/antibody incubation/product/Bioss
    Average 94 stars, based on 1 article reviews
    antibody incubation - by Bioz Stars, 2026-02
    94/100 stars
      Buy from Supplier

    Image Search Results


    a. A schematic of CD33/Siglec-3 long (CD33 M )( Top ), short (CD33 m ) ( Middle ) and CD33 MΔ4bp ( Bottom ) isoforms indicating signal peptide (sig pep, green), two Ig-like domains (blue, purple), transmembrane helix (red) and cytoplasmic tail (yellow). Glycosylation sites are indicated by red lollipops and disulphide bonds by black lines connecting Cys residues. b. Cartoon of the CD33 M ECD structure in two views rotated 90° about the vertical axis. The sheets in the V-set domain are green (C′CFGG′A) and blue (ABED), and the C2-set domain pink (CFG) and purple (ABED). The variable CC′ and GG′ loops are coloured purple and orange, respectively. The V-set domain is stabilised by a disulphide bond between the BBʹ loop (Cys 41) and the E strand (Cys 101). The three N -linked GlcNAc residues attached to the V-set domain (Asn100) and C2-set domain (Asn160 and 209) are shown in stick form and labelled by the amino acid to which they are linked c. A cartoon of the CD33 V-set domain structure highlighting important features for binding, and regions of difference to other siglec structures. Arg119, required for binding sialic acid, is shown in stick form (magenta). Regions of significant deviation to other siglecs are limited to the BC loop and the CC’ loop. The CC‘ loop occupies conformations varying from more open (CD33 M ) to closed (Siglec-5) over the binding site. d. Images of the ligand binding sites with bound 3′-sialyllactose. The polypeptide chain is shown in cartoon representation with the residues constituting the binding site in stick form. The sialyllactoses are shown in ball-and-stick format (carbon atoms – light blue, oxygen – red, nitrogen – dark blue) with omit mFo-DFc electron density contoured at 2 σ. The electron density maps were supportive of inclusion of sialic acid and Gal residues, but insufficient to model Glc. The CC′ loop is indicated and, in contrast to other Siglecs, makes no direct interactions with the ligands. e. Images of the ligand binding sites with bound 6′-sialyllactose.

    Journal: bioRxiv

    Article Title: CD33 and clusterin interact biophysically and genetically to modulate Alzheimer risk

    doi: 10.1101/2025.07.29.667318

    Figure Lengend Snippet: a. A schematic of CD33/Siglec-3 long (CD33 M )( Top ), short (CD33 m ) ( Middle ) and CD33 MΔ4bp ( Bottom ) isoforms indicating signal peptide (sig pep, green), two Ig-like domains (blue, purple), transmembrane helix (red) and cytoplasmic tail (yellow). Glycosylation sites are indicated by red lollipops and disulphide bonds by black lines connecting Cys residues. b. Cartoon of the CD33 M ECD structure in two views rotated 90° about the vertical axis. The sheets in the V-set domain are green (C′CFGG′A) and blue (ABED), and the C2-set domain pink (CFG) and purple (ABED). The variable CC′ and GG′ loops are coloured purple and orange, respectively. The V-set domain is stabilised by a disulphide bond between the BBʹ loop (Cys 41) and the E strand (Cys 101). The three N -linked GlcNAc residues attached to the V-set domain (Asn100) and C2-set domain (Asn160 and 209) are shown in stick form and labelled by the amino acid to which they are linked c. A cartoon of the CD33 V-set domain structure highlighting important features for binding, and regions of difference to other siglec structures. Arg119, required for binding sialic acid, is shown in stick form (magenta). Regions of significant deviation to other siglecs are limited to the BC loop and the CC’ loop. The CC‘ loop occupies conformations varying from more open (CD33 M ) to closed (Siglec-5) over the binding site. d. Images of the ligand binding sites with bound 3′-sialyllactose. The polypeptide chain is shown in cartoon representation with the residues constituting the binding site in stick form. The sialyllactoses are shown in ball-and-stick format (carbon atoms – light blue, oxygen – red, nitrogen – dark blue) with omit mFo-DFc electron density contoured at 2 σ. The electron density maps were supportive of inclusion of sialic acid and Gal residues, but insufficient to model Glc. The CC′ loop is indicated and, in contrast to other Siglecs, makes no direct interactions with the ligands. e. Images of the ligand binding sites with bound 6′-sialyllactose.

    Article Snippet: In the first antibody incubation, rabbit anti-human CD33 (Bioss, bs-2042R, 1:400) and mouse anti-human SHP-1 (Thermo Scientific, MA5-38614, 1: 400), were performed overnight at 4°C.

    Techniques: Glycoproteomics, Binding Assay, Ligand Binding Assay

    Structural alignments of i – four CD33 V-set domain structures: 5IHB (lime), 6D48 (purple), 7AW6 (blue) and AF_P20138_F1 (AlphaFold2 model, green); ii V-set domains of sialoadhesin (1OD9, red), CD33 (blue), Siglec-5 (2ZG2, green) and Siglec-7 (2HRL, purple). Significant deviations are limited to the BC loop and the CC′ loop. The CC′ loop occupies conformations varying from more open (CD33 M ) to closed (Siglec-5) over the binding site; iii full-length ECDs of 5IHB (cyan) and 7AW6 (purple) aligned on C2-set domain only. All structures were aligned using the align algorithm in PyMOL.

    Journal: bioRxiv

    Article Title: CD33 and clusterin interact biophysically and genetically to modulate Alzheimer risk

    doi: 10.1101/2025.07.29.667318

    Figure Lengend Snippet: Structural alignments of i – four CD33 V-set domain structures: 5IHB (lime), 6D48 (purple), 7AW6 (blue) and AF_P20138_F1 (AlphaFold2 model, green); ii V-set domains of sialoadhesin (1OD9, red), CD33 (blue), Siglec-5 (2ZG2, green) and Siglec-7 (2HRL, purple). Significant deviations are limited to the BC loop and the CC′ loop. The CC′ loop occupies conformations varying from more open (CD33 M ) to closed (Siglec-5) over the binding site; iii full-length ECDs of 5IHB (cyan) and 7AW6 (purple) aligned on C2-set domain only. All structures were aligned using the align algorithm in PyMOL.

    Article Snippet: In the first antibody incubation, rabbit anti-human CD33 (Bioss, bs-2042R, 1:400) and mouse anti-human SHP-1 (Thermo Scientific, MA5-38614, 1: 400), were performed overnight at 4°C.

    Techniques: Binding Assay

    Left panel - Cartoon showing a structural alignment between the C2-set domains of CD33 (green) and Siglec-5 (blue), with an RMSD = 0.93 Å. Whereas the CD33 domain possesses a D strand, the region between the C and E strands in Siglec-5 occupies a non-regular loop conformation Right panel: Structural alignment of the C2-set domains of CD33 (green) and ICAM-3 (purple). Both domains possess a D strand. RMSD = 1.9 Å.

    Journal: bioRxiv

    Article Title: CD33 and clusterin interact biophysically and genetically to modulate Alzheimer risk

    doi: 10.1101/2025.07.29.667318

    Figure Lengend Snippet: Left panel - Cartoon showing a structural alignment between the C2-set domains of CD33 (green) and Siglec-5 (blue), with an RMSD = 0.93 Å. Whereas the CD33 domain possesses a D strand, the region between the C and E strands in Siglec-5 occupies a non-regular loop conformation Right panel: Structural alignment of the C2-set domains of CD33 (green) and ICAM-3 (purple). Both domains possess a D strand. RMSD = 1.9 Å.

    Article Snippet: In the first antibody incubation, rabbit anti-human CD33 (Bioss, bs-2042R, 1:400) and mouse anti-human SHP-1 (Thermo Scientific, MA5-38614, 1: 400), were performed overnight at 4°C.

    Techniques:

    A schematic of the ligand binding site showing the interactions between CD33 and 3’-sialyllactose (identical interactions are seen for 6’-sialyllactose). No interactions are made with the galactose or glucose residues. Figure prepared using PoseView.

    Journal: bioRxiv

    Article Title: CD33 and clusterin interact biophysically and genetically to modulate Alzheimer risk

    doi: 10.1101/2025.07.29.667318

    Figure Lengend Snippet: A schematic of the ligand binding site showing the interactions between CD33 and 3’-sialyllactose (identical interactions are seen for 6’-sialyllactose). No interactions are made with the galactose or glucose residues. Figure prepared using PoseView.

    Article Snippet: In the first antibody incubation, rabbit anti-human CD33 (Bioss, bs-2042R, 1:400) and mouse anti-human SHP-1 (Thermo Scientific, MA5-38614, 1: 400), were performed overnight at 4°C.

    Techniques: Ligand Binding Assay

    a. Cartoon showing the dimerization of two CD33 M ectodomain chains (teal and pink) mediated by their C2-set domains. The two C strands hydrogen bond in a parallel fashion to create a continuous β-sheet (GFCCFG) and the remainder of the interface is formed by residues from the CD33-specific D strand. The C2-set dimeric interface and the rigid nature of the V-set/C2-set interface places the two ligand binding sites 40 Å apart, facing outwards from the central axis of the dimer and pointing away from one another. b. Surface representation of CD33 M ectodomain colour-coded according to conservation (purple – conserved, cyan – non-conserved). The conserved patch constituting the dimer interface is indicated. c. Dimeric CD33 M is robustly targeted to the cell surface in both CD33 M /CD33 M and CD33 M /CD33 m expressing cells : representative flow cytometry analyses showing CD33 M and CD33 m surface labelling in cells expressing CD33 M only (CD33 M / M ), CD33 m only (CD33 m / m ) or CD33 M and CD33 m (CD33 M / m ), reveals that the majority of both CD33 M / M and CD33 M / m cells have similarly robust surface exposure of CD33 M . We were not able to include CD33 M-5X cells in these experiments because the 5X dimer site mutant disrupts the recognition motif for the anti-CD33 antibody that recognizes CD33 M in fluorescence flow cytometry. Cells were double stained using antibodies specific to CD33 M (WM53) and CD33 m (A16121H) respectively shows, in the displayed experiment (see ), that most CD33 M / M cells (upper left, Q1+Q2: 93.8% + 0.62%) or CD33 M / m cells (upper right, Q1+Q2: 71.5% + 23.3%) are surface CD33 M positive. Only a small portion of cells in CD33 M / m cells (upper right, Q2+Q3: 23.3% + 0.11%) are CD33 m positive. In the CD33 m / m (lower left, Q2+Q3: 0.25% + 43.6%) cells, CD33 m positive cells are less than a half of the total cells. Figures show one experiment out of three independent experiments (each with 6 technical replicates) with similar results. The MFI statistics of CD33M and CD33m from three independent experiments are shown in Extended Figure 2J d. Single staining using the HIM3-4 antibody, which recognises both CD33 M and CD33 m , shows much greater surface exposure of CD33 M in CD33 M / M cells (red) than there is surface exposure of CD33 m in CD33 m / m (green) cells. e. Schematic of single-molecule TIRF imaging of CHO cells expressing SNAP f -CD33 M labeled with donor and acceptor fluorophores . The colours on the dimer cartoon reflect the same CD33 domains as in . f. Representative smFRET trajectory and its corresponding fluorescence and FRET time traces for the CD33 M receptor (bottom panel). The smFRET trajectory for the individual molecule is shown to the left of its fluorescence (donor and acceptor trajectories and intensities are shown in green and red, respectively) and FRET trace (in blue). The green and red bars along the time axis in the fluorescence time trace plot indicate that the signal was derived during tracking. g. Top panels: Representative image from a movie (frame 2, 0.03 s) of labeled SNAP f - CD33 M e xcited by the donor laser (532 nm), with the enlarged view (bottom panels) showing sensitized acceptor signals that have colocalizing trajectories with their corresponding donors, both delineated by white circles. (See cartoon in Supplementary Figure 2K for methodology) Scale bar, 5 μm; enlarged view, 9.1 μm × 7.3 μm. Donors without colocalized acceptor are consistent with the stochastic labeling approach employed in which a population of dimers labeled with two donors or only one donor and no acceptor is possible. h. Distributions of smFRET events per cell area for SNAP f -CD33 M , -CD33 M-5X , and -CD33 m , all labeled with donor and acceptor (Don-Acc) as well as SNAP f -CD33 M labeled with only donor (Don-only). The smFRET events represent the total number of freely diffusing smFRET trajectories (see cartoon in Supplementary Figure 2K for methodology). Dots represent smFRET events per area for each cell. Box plots indicate the median (value shown as the central line) and interquartile range (lower and upper lines represent the 25th and 75th percentiles, respectively), while the whiskers represent the points that fall within 1.5 × interquartile range. The indicated total number of cells ( n cells) were collected over 4 independent experiments for the CD33 M and CD33 m samples, and 3 independent experiments for the CD33 M-5X and CD33 M donor only samples. ***, p = 1.3 × 10 -8 ; ***, p = 1.6 × 10 -8 ; **, p = 0.0056; *, p = 0.011; ns = 0.99; ordinary one-way ANOVA with Šídák’s post- hoc multiple comparisons test. i. CD33 MΔ4bp variant forms a stable soluble protein in cell lysates and is secreted into the media , where it may bind with the extracellular domains of CD33 M and CD33 m . There may be a similar physiological soluble CD33 protein that is either shed into the medium by CD33 M ectodomain proteolysis or is produced as an alternative splicing product. A cartoon showing the domain structures and epitope tags of CD33 M , CD33 m , CD33 Δ4bp and the putative soluble CD33 M ectodomain product (sCD33 M ) is included in . j. Western blot analysis of CD33 immunoprecipitated by the CD33 Ig-like V-set domain antibody (ab134115) from lysates and conditioned medium of iMGs . Immunoprecipitation products were probed for CD33 using the CD33 Ig-like C2-set domain antibody (PWS44). The data demonstrate the presence of fuzzy, likely glycosylated soluble CD33- immunoreactvive (sCD33) cleavage product in the medium, but not in iMG cell lysates. Notably, sCD33 increases upon stimulation of the iMG cells with 300 nM CLU (lane 5). k. Western blot of lysates and HA-immunoprecipitation products from HEK293 cells expressing CD33 M -HA, CD33 m -HA and CD33 MΔ4bp. HA-immunoprecipitation products were probed with the anti-CD33 antibody (ab134115) which recognises only epitopes in the V-set domain. Arrowheads denote CD33 derivative protein. Representative blots for n = 3 independent biological replicates. The result reveals that CD33 MΔ4bp co-precipitates with CD33 M and CD33 m . These studies do not distinguish whether this interaction occurs in the intracellular compartment or whether they occur at the cell surface.

    Journal: bioRxiv

    Article Title: CD33 and clusterin interact biophysically and genetically to modulate Alzheimer risk

    doi: 10.1101/2025.07.29.667318

    Figure Lengend Snippet: a. Cartoon showing the dimerization of two CD33 M ectodomain chains (teal and pink) mediated by their C2-set domains. The two C strands hydrogen bond in a parallel fashion to create a continuous β-sheet (GFCCFG) and the remainder of the interface is formed by residues from the CD33-specific D strand. The C2-set dimeric interface and the rigid nature of the V-set/C2-set interface places the two ligand binding sites 40 Å apart, facing outwards from the central axis of the dimer and pointing away from one another. b. Surface representation of CD33 M ectodomain colour-coded according to conservation (purple – conserved, cyan – non-conserved). The conserved patch constituting the dimer interface is indicated. c. Dimeric CD33 M is robustly targeted to the cell surface in both CD33 M /CD33 M and CD33 M /CD33 m expressing cells : representative flow cytometry analyses showing CD33 M and CD33 m surface labelling in cells expressing CD33 M only (CD33 M / M ), CD33 m only (CD33 m / m ) or CD33 M and CD33 m (CD33 M / m ), reveals that the majority of both CD33 M / M and CD33 M / m cells have similarly robust surface exposure of CD33 M . We were not able to include CD33 M-5X cells in these experiments because the 5X dimer site mutant disrupts the recognition motif for the anti-CD33 antibody that recognizes CD33 M in fluorescence flow cytometry. Cells were double stained using antibodies specific to CD33 M (WM53) and CD33 m (A16121H) respectively shows, in the displayed experiment (see ), that most CD33 M / M cells (upper left, Q1+Q2: 93.8% + 0.62%) or CD33 M / m cells (upper right, Q1+Q2: 71.5% + 23.3%) are surface CD33 M positive. Only a small portion of cells in CD33 M / m cells (upper right, Q2+Q3: 23.3% + 0.11%) are CD33 m positive. In the CD33 m / m (lower left, Q2+Q3: 0.25% + 43.6%) cells, CD33 m positive cells are less than a half of the total cells. Figures show one experiment out of three independent experiments (each with 6 technical replicates) with similar results. The MFI statistics of CD33M and CD33m from three independent experiments are shown in Extended Figure 2J d. Single staining using the HIM3-4 antibody, which recognises both CD33 M and CD33 m , shows much greater surface exposure of CD33 M in CD33 M / M cells (red) than there is surface exposure of CD33 m in CD33 m / m (green) cells. e. Schematic of single-molecule TIRF imaging of CHO cells expressing SNAP f -CD33 M labeled with donor and acceptor fluorophores . The colours on the dimer cartoon reflect the same CD33 domains as in . f. Representative smFRET trajectory and its corresponding fluorescence and FRET time traces for the CD33 M receptor (bottom panel). The smFRET trajectory for the individual molecule is shown to the left of its fluorescence (donor and acceptor trajectories and intensities are shown in green and red, respectively) and FRET trace (in blue). The green and red bars along the time axis in the fluorescence time trace plot indicate that the signal was derived during tracking. g. Top panels: Representative image from a movie (frame 2, 0.03 s) of labeled SNAP f - CD33 M e xcited by the donor laser (532 nm), with the enlarged view (bottom panels) showing sensitized acceptor signals that have colocalizing trajectories with their corresponding donors, both delineated by white circles. (See cartoon in Supplementary Figure 2K for methodology) Scale bar, 5 μm; enlarged view, 9.1 μm × 7.3 μm. Donors without colocalized acceptor are consistent with the stochastic labeling approach employed in which a population of dimers labeled with two donors or only one donor and no acceptor is possible. h. Distributions of smFRET events per cell area for SNAP f -CD33 M , -CD33 M-5X , and -CD33 m , all labeled with donor and acceptor (Don-Acc) as well as SNAP f -CD33 M labeled with only donor (Don-only). The smFRET events represent the total number of freely diffusing smFRET trajectories (see cartoon in Supplementary Figure 2K for methodology). Dots represent smFRET events per area for each cell. Box plots indicate the median (value shown as the central line) and interquartile range (lower and upper lines represent the 25th and 75th percentiles, respectively), while the whiskers represent the points that fall within 1.5 × interquartile range. The indicated total number of cells ( n cells) were collected over 4 independent experiments for the CD33 M and CD33 m samples, and 3 independent experiments for the CD33 M-5X and CD33 M donor only samples. ***, p = 1.3 × 10 -8 ; ***, p = 1.6 × 10 -8 ; **, p = 0.0056; *, p = 0.011; ns = 0.99; ordinary one-way ANOVA with Šídák’s post- hoc multiple comparisons test. i. CD33 MΔ4bp variant forms a stable soluble protein in cell lysates and is secreted into the media , where it may bind with the extracellular domains of CD33 M and CD33 m . There may be a similar physiological soluble CD33 protein that is either shed into the medium by CD33 M ectodomain proteolysis or is produced as an alternative splicing product. A cartoon showing the domain structures and epitope tags of CD33 M , CD33 m , CD33 Δ4bp and the putative soluble CD33 M ectodomain product (sCD33 M ) is included in . j. Western blot analysis of CD33 immunoprecipitated by the CD33 Ig-like V-set domain antibody (ab134115) from lysates and conditioned medium of iMGs . Immunoprecipitation products were probed for CD33 using the CD33 Ig-like C2-set domain antibody (PWS44). The data demonstrate the presence of fuzzy, likely glycosylated soluble CD33- immunoreactvive (sCD33) cleavage product in the medium, but not in iMG cell lysates. Notably, sCD33 increases upon stimulation of the iMG cells with 300 nM CLU (lane 5). k. Western blot of lysates and HA-immunoprecipitation products from HEK293 cells expressing CD33 M -HA, CD33 m -HA and CD33 MΔ4bp. HA-immunoprecipitation products were probed with the anti-CD33 antibody (ab134115) which recognises only epitopes in the V-set domain. Arrowheads denote CD33 derivative protein. Representative blots for n = 3 independent biological replicates. The result reveals that CD33 MΔ4bp co-precipitates with CD33 M and CD33 m . These studies do not distinguish whether this interaction occurs in the intracellular compartment or whether they occur at the cell surface.

    Article Snippet: In the first antibody incubation, rabbit anti-human CD33 (Bioss, bs-2042R, 1:400) and mouse anti-human SHP-1 (Thermo Scientific, MA5-38614, 1: 400), were performed overnight at 4°C.

    Techniques: Ligand Binding Assay, Expressing, Flow Cytometry, Mutagenesis, Fluorescence, Staining, Imaging, Labeling, Derivative Assay, Variant Assay, Produced, Alternative Splicing, Western Blot, Immunoprecipitation

    Sequence conservation of dimer interface residues in CD33 C2-set domains of multiple human Siglecs. This region was identified by the EPPIC program as likely to form biologically authentic dimer interfaces. Red arrows depict residues determined by EPPIC to have > 95% buried surface area in the interface, green arrows residues with > 70% buried surface area. These are highly conserved in a subset of the sequences.

    Journal: bioRxiv

    Article Title: CD33 and clusterin interact biophysically and genetically to modulate Alzheimer risk

    doi: 10.1101/2025.07.29.667318

    Figure Lengend Snippet: Sequence conservation of dimer interface residues in CD33 C2-set domains of multiple human Siglecs. This region was identified by the EPPIC program as likely to form biologically authentic dimer interfaces. Red arrows depict residues determined by EPPIC to have > 95% buried surface area in the interface, green arrows residues with > 70% buried surface area. These are highly conserved in a subset of the sequences.

    Article Snippet: In the first antibody incubation, rabbit anti-human CD33 (Bioss, bs-2042R, 1:400) and mouse anti-human SHP-1 (Thermo Scientific, MA5-38614, 1: 400), were performed overnight at 4°C.

    Techniques: Sequencing

    Blue-Native PAGE analysis of digitonin-lysed native CD33 from fresh human peripheral blood monocytes and THP-1 cells. Western blotting with an anti-CD33 antibody demonstrates a species migrating in excess of the predicted monomeric size of 67- 75 kDa.

    Journal: bioRxiv

    Article Title: CD33 and clusterin interact biophysically and genetically to modulate Alzheimer risk

    doi: 10.1101/2025.07.29.667318

    Figure Lengend Snippet: Blue-Native PAGE analysis of digitonin-lysed native CD33 from fresh human peripheral blood monocytes and THP-1 cells. Western blotting with an anti-CD33 antibody demonstrates a species migrating in excess of the predicted monomeric size of 67- 75 kDa.

    Article Snippet: In the first antibody incubation, rabbit anti-human CD33 (Bioss, bs-2042R, 1:400) and mouse anti-human SHP-1 (Thermo Scientific, MA5-38614, 1: 400), were performed overnight at 4°C.

    Techniques: Blue Native PAGE, Western Blot

    Mutagenesis of Phe177Ala + Trp179Ala + Leu180Ala + Arg190Ala + Gln213Ala residues within the dimer site was performed to disrupt the hydrophobic and polar interactions in the dimer site. Mutation of any combination of 1-4 of these 5 residues had no effect on dimer formation. However. mutation of all 5 residues resulted in formation of stable, fully glycosylated CD33 M and CD33 m monomers that do not co-precipitate other CD33 peptides

    Journal: bioRxiv

    Article Title: CD33 and clusterin interact biophysically and genetically to modulate Alzheimer risk

    doi: 10.1101/2025.07.29.667318

    Figure Lengend Snippet: Mutagenesis of Phe177Ala + Trp179Ala + Leu180Ala + Arg190Ala + Gln213Ala residues within the dimer site was performed to disrupt the hydrophobic and polar interactions in the dimer site. Mutation of any combination of 1-4 of these 5 residues had no effect on dimer formation. However. mutation of all 5 residues resulted in formation of stable, fully glycosylated CD33 M and CD33 m monomers that do not co-precipitate other CD33 peptides

    Article Snippet: In the first antibody incubation, rabbit anti-human CD33 (Bioss, bs-2042R, 1:400) and mouse anti-human SHP-1 (Thermo Scientific, MA5-38614, 1: 400), were performed overnight at 4°C.

    Techniques: Mutagenesis

    a. CD33 M co-immunoprecipitates sialylated CLU, but not desialylated CLU. Endogenous human CD33 expressed on human monocytic U937 cells interact with native human plasma CLU, but not with desialylated CLU applied to the culture supernatant. The graph shows quantification of western blots of anti-CD33 co-immunoprecipitation products from cell lysates, blotted with anti-CLU antibodies. Quantification is performed by measuring the band intensities on autoradiograms of co-IP Western blots using anti-CD33 and anti-CLU antibodies to detect CD33 and coprecipitating CLU respectively. The result (CD33-bound CLU) is expressed as the ratio of CLU to CD33 band intensities as arbitrary units (a.u.). Representative western blot is shown in left panel. *** = p<0.0001; Student t-test; error bars = mean ± SEM CLU: 1.23±0.04; desCLU: 0.23 ± 0.051; n = 5 independent replications. b. CD33 M but not CD33 m co-immunoprecipitates with CLU. The graph shows quantification of CLU co-precipitating with CD33 M in HEK293 cells as measured by the band intensities on western blots of the co-immunoprecipitating products. The results are expressed as CD33-bound CLU using arbitrary units to depict the ratio of CLU band intensity relative to the CD33 band intensity. HEK293 cells expressed: CD33 M only (CD33 M/M dimers), both CD33 M and CD33 m (CD33 M/M ; CD33 M / m or CD33 m/m dimers) (CLU does not co-precipitate with CD33 in cells expressing only CD33 m/m dimers). Graph columns 3 and 4 depict the results for cells expressing both CD33 M and CD33 m . The third column shows the CLU: CD33 M ratio. The fourth column shows the CD33 bound-CLU ratio computed for total cellular CD33. The HA epitope tag on both CD33 M and CD33m is used to measure both CD33 M and CD33 m immunoreactivities (CD33 Total ). A representative blot is shown in , right panel *** = p<0.00001; two-tailed Student t- tests; error bars = mean ± SEM CD33 M : 0.85 ± 0.023; CD33m: 0.004 ± 0.00043; CD33 M / m : 0.45±0.041; n = 5 biological replications. c. Dimerization of CD33 is required for CLU binding Co-IP studies on lysates from HEK293 cells expressing similar quantities of CD33 M reveal that much less CLU is co- precipitated with the CD33 M-5X dimer interface mutant than with wild type CD33 M . The data is quantified as in panel b. A representative western blot is available in . *** p<0.00001, error bars = mean ± SEM CD33 M : 0.425 ± 0.0073; CD33 M- 5X : 0.012 ± 0.006; n = 5 replications. Each lane represents one independent biological replication of the respective condition. d. CLU binds to CD33 M ECD with nanomolar avidity via sialic acids: i. BLI curves of CLU binding to CD33 M ECD WT; ii. Desialylated-CLU showed no detectable binding to CD33 M ECD WT; iii . CD33 M ECD R119A mutant showed no detectable CLU binding. CLU concentrations are indicated. Each binding curve is the average of n = 4 independent measurements; iv . R119A mutation of the canonical sialic acid binding site disrupts CLU binding. Steady-state BLI analysis of the CLU binding to CD33 M ECD WT (yellow square) or CD33 M ECD R119A (open square) and desialylated-human CLU to CD33 M ECD WT (pink square). Curve fitting was performed using Hill equation. Equilibrium dissociation constant is 27.9 ± 7.2 nM. This result is not due to misfolding of the CD33 M R119A protein because the Far UV CD spectra of wild type and R119A proteins are similar . Error bars = SD. n = 4 independent replications; v. CLU+Aβ 1-42 showed similar binding avidity to CD33 M ectodomain with CLU alone. Steady-state BLI analysis of the CLU/Aβ 1-42 mixture binding to CD33 M ECD WT (teal square). yellow squares indicate binding responses of CLU alone to CD33 M ECD WT. Curve fitting was performed using Hill equation. Equilibrium dissociation constant of CLU/Aβ42 is 28.2 ± 4.9 nM; vi. BLI curves of CLU/Aβ 1-42 mixture binding to CD33 M ECD WT. Binding curves obtained from the same concentration of Aβ 1-42 alone was subtracted from the curve from CLU/Aβ 1-42 mixture. Each curve is the average of four independent measurements. CLU/Aβ 1-42 concentrations are indicated. Error bars = SD, n = 4 independent biological replications. e. ApoE does not bind to CD33 . Representative western blots for co-immunoprecipitation of ApoE isoforms with His-tagged CD33 and ApoER2. 20µg wild-type (WT) and mutant (R119A) CD33 proteins with or without glycosylation (G) fused to His-tag were incubated with 50µl dynabeads, followed by incubation with 500µl of ApoE3 or ApoE4 (3µg/ml). ApoE bound to CD33 and ApoER2 was detected by immunoblots using anti-ApoE antibody. Beads only and ApoER2 ectodomain with His-tag were used for negative and positive controls, respectively. N = 4 replications.

    Journal: bioRxiv

    Article Title: CD33 and clusterin interact biophysically and genetically to modulate Alzheimer risk

    doi: 10.1101/2025.07.29.667318

    Figure Lengend Snippet: a. CD33 M co-immunoprecipitates sialylated CLU, but not desialylated CLU. Endogenous human CD33 expressed on human monocytic U937 cells interact with native human plasma CLU, but not with desialylated CLU applied to the culture supernatant. The graph shows quantification of western blots of anti-CD33 co-immunoprecipitation products from cell lysates, blotted with anti-CLU antibodies. Quantification is performed by measuring the band intensities on autoradiograms of co-IP Western blots using anti-CD33 and anti-CLU antibodies to detect CD33 and coprecipitating CLU respectively. The result (CD33-bound CLU) is expressed as the ratio of CLU to CD33 band intensities as arbitrary units (a.u.). Representative western blot is shown in left panel. *** = p<0.0001; Student t-test; error bars = mean ± SEM CLU: 1.23±0.04; desCLU: 0.23 ± 0.051; n = 5 independent replications. b. CD33 M but not CD33 m co-immunoprecipitates with CLU. The graph shows quantification of CLU co-precipitating with CD33 M in HEK293 cells as measured by the band intensities on western blots of the co-immunoprecipitating products. The results are expressed as CD33-bound CLU using arbitrary units to depict the ratio of CLU band intensity relative to the CD33 band intensity. HEK293 cells expressed: CD33 M only (CD33 M/M dimers), both CD33 M and CD33 m (CD33 M/M ; CD33 M / m or CD33 m/m dimers) (CLU does not co-precipitate with CD33 in cells expressing only CD33 m/m dimers). Graph columns 3 and 4 depict the results for cells expressing both CD33 M and CD33 m . The third column shows the CLU: CD33 M ratio. The fourth column shows the CD33 bound-CLU ratio computed for total cellular CD33. The HA epitope tag on both CD33 M and CD33m is used to measure both CD33 M and CD33 m immunoreactivities (CD33 Total ). A representative blot is shown in , right panel *** = p<0.00001; two-tailed Student t- tests; error bars = mean ± SEM CD33 M : 0.85 ± 0.023; CD33m: 0.004 ± 0.00043; CD33 M / m : 0.45±0.041; n = 5 biological replications. c. Dimerization of CD33 is required for CLU binding Co-IP studies on lysates from HEK293 cells expressing similar quantities of CD33 M reveal that much less CLU is co- precipitated with the CD33 M-5X dimer interface mutant than with wild type CD33 M . The data is quantified as in panel b. A representative western blot is available in . *** p<0.00001, error bars = mean ± SEM CD33 M : 0.425 ± 0.0073; CD33 M- 5X : 0.012 ± 0.006; n = 5 replications. Each lane represents one independent biological replication of the respective condition. d. CLU binds to CD33 M ECD with nanomolar avidity via sialic acids: i. BLI curves of CLU binding to CD33 M ECD WT; ii. Desialylated-CLU showed no detectable binding to CD33 M ECD WT; iii . CD33 M ECD R119A mutant showed no detectable CLU binding. CLU concentrations are indicated. Each binding curve is the average of n = 4 independent measurements; iv . R119A mutation of the canonical sialic acid binding site disrupts CLU binding. Steady-state BLI analysis of the CLU binding to CD33 M ECD WT (yellow square) or CD33 M ECD R119A (open square) and desialylated-human CLU to CD33 M ECD WT (pink square). Curve fitting was performed using Hill equation. Equilibrium dissociation constant is 27.9 ± 7.2 nM. This result is not due to misfolding of the CD33 M R119A protein because the Far UV CD spectra of wild type and R119A proteins are similar . Error bars = SD. n = 4 independent replications; v. CLU+Aβ 1-42 showed similar binding avidity to CD33 M ectodomain with CLU alone. Steady-state BLI analysis of the CLU/Aβ 1-42 mixture binding to CD33 M ECD WT (teal square). yellow squares indicate binding responses of CLU alone to CD33 M ECD WT. Curve fitting was performed using Hill equation. Equilibrium dissociation constant of CLU/Aβ42 is 28.2 ± 4.9 nM; vi. BLI curves of CLU/Aβ 1-42 mixture binding to CD33 M ECD WT. Binding curves obtained from the same concentration of Aβ 1-42 alone was subtracted from the curve from CLU/Aβ 1-42 mixture. Each curve is the average of four independent measurements. CLU/Aβ 1-42 concentrations are indicated. Error bars = SD, n = 4 independent biological replications. e. ApoE does not bind to CD33 . Representative western blots for co-immunoprecipitation of ApoE isoforms with His-tagged CD33 and ApoER2. 20µg wild-type (WT) and mutant (R119A) CD33 proteins with or without glycosylation (G) fused to His-tag were incubated with 50µl dynabeads, followed by incubation with 500µl of ApoE3 or ApoE4 (3µg/ml). ApoE bound to CD33 and ApoER2 was detected by immunoblots using anti-ApoE antibody. Beads only and ApoER2 ectodomain with His-tag were used for negative and positive controls, respectively. N = 4 replications.

    Article Snippet: In the first antibody incubation, rabbit anti-human CD33 (Bioss, bs-2042R, 1:400) and mouse anti-human SHP-1 (Thermo Scientific, MA5-38614, 1: 400), were performed overnight at 4°C.

    Techniques: Clinical Proteomics, Western Blot, Immunoprecipitation, Co-Immunoprecipitation Assay, Expressing, Two Tailed Test, Binding Assay, Mutagenesis, Circular Dichroism, Concentration Assay, Glycoproteomics, Incubation

    SEC-MALS demonstrates CD33 ECD dimers in solution Left Panel - SEC-MALS analysis of Endo H f -trimmed CD33 ECD. Shown are plots of refractive index (RI, right axis) and evaluated molar mass (left axis) against elution volume for samples loaded at 2.5 mg/ml (blue) and 0.5 mg/ml (red). The glycan-trimmed sample were considered as all protein but still analysed using either UV and RI as concentration signals. At the higher concentration (∼ 10 µM on column), RI indicates a mass of 47 kDa over the central 50 % of the peak while analysis using UV absorbance as the concentration source gives a mass of 50 kDa. These results confirm that CD33 ECD is present predominantly as a dimer in solution at the concentrations achieved over the central 50% of the SEC peak (∼ 5-10 µM). At the lower concentration loaded (∼ 2 µM on column) the apparent mass is slightly lower at 41 kDa and 44kDa (RI, UV). Consequently we can estimate that the Kd for this dimerisation is much below µM and probably on the order of 100s of nM. Right Panel - SEC-MALS of fully glycosylated CD33 ECD. As for the trimmed sample, protein was loaded at 2.5 mg/ml (blue) and 0.5 mg/ml (red). The glycosylated samples eluted overall earlier than the Endo H- trimmed samples consistent with a higher expected mass and larger hydrodynamic properties contributed by the additional carbohydrate. Due to the significant contribution of glycans to the mass of the system, a dual concentration conjugate analysis was applied ( dn/dc protein 0.1885 ml g -1 , dn/dc carbohydrate 0.145 ml g -1 , UV protein 1252 ml g -1 cm -1 , UV carbohydrate no absorbance). This analysis evaluates a protein mass of about 43 kDa (symbol +) and a carbohydrate mass of about 18 kDa (symbol X) consistent with dimer formation and with the predicted mass of the carbohydrate modifications on CD33 giving a total mass around 60 kDa (symbol filled square). Bottom Panel - QELS measurements (DLS) made for the SEC-MALS samples injected at 2.5 mg/ml. The hydrodynamic radius calculated for glycosylated CD33 ECD (black) of 3.5 nm is larger than expected for a 50kDa dimeric protein (for example, larger than that of the BSA standard (green) which is a 66 kDa protein) consistent with the presence of the extensive carbohydrate modifications GlcNAc 2 Man 9 at 5 positions. Endo H f -trimmed CD33 ECD (blue) has an Rh of 3.0 nm, which is more consistent with a simple globular protein of 50 kDa mass as expected following the almost complete removal of its carbohydrate adducts.

    Journal: bioRxiv

    Article Title: CD33 and clusterin interact biophysically and genetically to modulate Alzheimer risk

    doi: 10.1101/2025.07.29.667318

    Figure Lengend Snippet: SEC-MALS demonstrates CD33 ECD dimers in solution Left Panel - SEC-MALS analysis of Endo H f -trimmed CD33 ECD. Shown are plots of refractive index (RI, right axis) and evaluated molar mass (left axis) against elution volume for samples loaded at 2.5 mg/ml (blue) and 0.5 mg/ml (red). The glycan-trimmed sample were considered as all protein but still analysed using either UV and RI as concentration signals. At the higher concentration (∼ 10 µM on column), RI indicates a mass of 47 kDa over the central 50 % of the peak while analysis using UV absorbance as the concentration source gives a mass of 50 kDa. These results confirm that CD33 ECD is present predominantly as a dimer in solution at the concentrations achieved over the central 50% of the SEC peak (∼ 5-10 µM). At the lower concentration loaded (∼ 2 µM on column) the apparent mass is slightly lower at 41 kDa and 44kDa (RI, UV). Consequently we can estimate that the Kd for this dimerisation is much below µM and probably on the order of 100s of nM. Right Panel - SEC-MALS of fully glycosylated CD33 ECD. As for the trimmed sample, protein was loaded at 2.5 mg/ml (blue) and 0.5 mg/ml (red). The glycosylated samples eluted overall earlier than the Endo H- trimmed samples consistent with a higher expected mass and larger hydrodynamic properties contributed by the additional carbohydrate. Due to the significant contribution of glycans to the mass of the system, a dual concentration conjugate analysis was applied ( dn/dc protein 0.1885 ml g -1 , dn/dc carbohydrate 0.145 ml g -1 , UV protein 1252 ml g -1 cm -1 , UV carbohydrate no absorbance). This analysis evaluates a protein mass of about 43 kDa (symbol +) and a carbohydrate mass of about 18 kDa (symbol X) consistent with dimer formation and with the predicted mass of the carbohydrate modifications on CD33 giving a total mass around 60 kDa (symbol filled square). Bottom Panel - QELS measurements (DLS) made for the SEC-MALS samples injected at 2.5 mg/ml. The hydrodynamic radius calculated for glycosylated CD33 ECD (black) of 3.5 nm is larger than expected for a 50kDa dimeric protein (for example, larger than that of the BSA standard (green) which is a 66 kDa protein) consistent with the presence of the extensive carbohydrate modifications GlcNAc 2 Man 9 at 5 positions. Endo H f -trimmed CD33 ECD (blue) has an Rh of 3.0 nm, which is more consistent with a simple globular protein of 50 kDa mass as expected following the almost complete removal of its carbohydrate adducts.

    Article Snippet: In the first antibody incubation, rabbit anti-human CD33 (Bioss, bs-2042R, 1:400) and mouse anti-human SHP-1 (Thermo Scientific, MA5-38614, 1: 400), were performed overnight at 4°C.

    Techniques: Refractive Index, Glycoproteomics, Concentration Assay, Injection

    Flow cytometry analysis by double staining on CD33 M /CD33 M , CD33 m /CD33 m or CD33 M /CD33 m transfected cells using antibodies specific to CD33 M (WM53) and CD33 m (A16121H) respectively. Mean Fluorescence Intensities (MFIs) of cells expressing CD33 M (upper) and CD33 m (lower) were quantified. Error bars represent SEM. Statistical analysis was performed using one-way ANOVA followed by Tukey’s test (n = 6, in 3 independent experiments, *** p .<0.001 vs M/m).

    Journal: bioRxiv

    Article Title: CD33 and clusterin interact biophysically and genetically to modulate Alzheimer risk

    doi: 10.1101/2025.07.29.667318

    Figure Lengend Snippet: Flow cytometry analysis by double staining on CD33 M /CD33 M , CD33 m /CD33 m or CD33 M /CD33 m transfected cells using antibodies specific to CD33 M (WM53) and CD33 m (A16121H) respectively. Mean Fluorescence Intensities (MFIs) of cells expressing CD33 M (upper) and CD33 m (lower) were quantified. Error bars represent SEM. Statistical analysis was performed using one-way ANOVA followed by Tukey’s test (n = 6, in 3 independent experiments, *** p .<0.001 vs M/m).

    Article Snippet: In the first antibody incubation, rabbit anti-human CD33 (Bioss, bs-2042R, 1:400) and mouse anti-human SHP-1 (Thermo Scientific, MA5-38614, 1: 400), were performed overnight at 4°C.

    Techniques: Flow Cytometry, Double Staining, Transfection, Fluorescence, Expressing

    Extended Data Figure 1K: Quantification of the surface density and diffusion states of labeled CD33 receptor samples. A , Surface densities prior to smFRET imaging of donor and acceptor labeled samples for smFRET studies. Dots represent the number of acceptor (nAcc) or donor (nDon) particles per area for the indicated number of single cells ( n cells) collected over 4 independent experiments for the CD33M and CD33m samples, and 3 independent experiments for the CD33M-5X and CD33M donor only samples. Box plot details are described in the legend of . The median density of total labeled (acceptor + donor) receptors ranged from 0.34 – 0.60 molecules/μm 2 . The median density of the donor only labeled CD33M sample was 0.22 molecules/μm 2 and near zero acceptors detected as expected. B , Total fraction of time spent in the immobile, confined, free, and directed diffusion states assigned by DC-MSS. Dots represent individual cell means and the middle and upper/lower lines depict the overall mean (values shown) and standard deviation, respectively, for 32 cells for the CD33M sample and 34 cells for the CD33m sample collected over 4 independent experiments.

    Journal: bioRxiv

    Article Title: CD33 and clusterin interact biophysically and genetically to modulate Alzheimer risk

    doi: 10.1101/2025.07.29.667318

    Figure Lengend Snippet: Extended Data Figure 1K: Quantification of the surface density and diffusion states of labeled CD33 receptor samples. A , Surface densities prior to smFRET imaging of donor and acceptor labeled samples for smFRET studies. Dots represent the number of acceptor (nAcc) or donor (nDon) particles per area for the indicated number of single cells ( n cells) collected over 4 independent experiments for the CD33M and CD33m samples, and 3 independent experiments for the CD33M-5X and CD33M donor only samples. Box plot details are described in the legend of . The median density of total labeled (acceptor + donor) receptors ranged from 0.34 – 0.60 molecules/μm 2 . The median density of the donor only labeled CD33M sample was 0.22 molecules/μm 2 and near zero acceptors detected as expected. B , Total fraction of time spent in the immobile, confined, free, and directed diffusion states assigned by DC-MSS. Dots represent individual cell means and the middle and upper/lower lines depict the overall mean (values shown) and standard deviation, respectively, for 32 cells for the CD33M sample and 34 cells for the CD33m sample collected over 4 independent experiments.

    Article Snippet: In the first antibody incubation, rabbit anti-human CD33 (Bioss, bs-2042R, 1:400) and mouse anti-human SHP-1 (Thermo Scientific, MA5-38614, 1: 400), were performed overnight at 4°C.

    Techniques: Diffusion-based Assay, Labeling, Imaging, Standard Deviation

    A broad-spectrum sheddase inhibitor, batimastat could reduce soluble CD33 in iMG conditioned medium . Differentiated iMGs were treated with 5 µM batimastat for 24 hours. Conditioned media was collected, centrifuged at 14,000 rpm for 10 minutes at 4°C. sCD33 were measured by ELISA (Abcam, ab283542) following the manufacturer’s protocol. Three independent wells of each treatments were collected, and all samples were assayed in duplicates. Statistical analysis was performed using paired t-test, p=0.0134.

    Journal: bioRxiv

    Article Title: CD33 and clusterin interact biophysically and genetically to modulate Alzheimer risk

    doi: 10.1101/2025.07.29.667318

    Figure Lengend Snippet: A broad-spectrum sheddase inhibitor, batimastat could reduce soluble CD33 in iMG conditioned medium . Differentiated iMGs were treated with 5 µM batimastat for 24 hours. Conditioned media was collected, centrifuged at 14,000 rpm for 10 minutes at 4°C. sCD33 were measured by ELISA (Abcam, ab283542) following the manufacturer’s protocol. Three independent wells of each treatments were collected, and all samples were assayed in duplicates. Statistical analysis was performed using paired t-test, p=0.0134.

    Article Snippet: In the first antibody incubation, rabbit anti-human CD33 (Bioss, bs-2042R, 1:400) and mouse anti-human SHP-1 (Thermo Scientific, MA5-38614, 1: 400), were performed overnight at 4°C.

    Techniques: Enzyme-linked Immunosorbent Assay

    Cartoons depicting: Left : the putative secretion of CD33 MΔ4BP and putative endoproteolytic shedding of sCD33 M , and the tagging and western blot strategy used here. The scissor cartoon depicts the site of a putative endoproteolytic cleavage or splice site that generates the endogenous soluble CD33 M ectodomain. Right : the putative binding of CD33 MΔ4BP (or speculatively sCD33 M ) to the extracellular domains of CD33 M or CD33 m . The CD33 MΔ4BP :CD33 M binding site is not defined., but could potentially recreate a dimeric ligand pocket with CD33 M monomers, and a monomeric ligand pocket with CD33 m .

    Journal: bioRxiv

    Article Title: CD33 and clusterin interact biophysically and genetically to modulate Alzheimer risk

    doi: 10.1101/2025.07.29.667318

    Figure Lengend Snippet: Cartoons depicting: Left : the putative secretion of CD33 MΔ4BP and putative endoproteolytic shedding of sCD33 M , and the tagging and western blot strategy used here. The scissor cartoon depicts the site of a putative endoproteolytic cleavage or splice site that generates the endogenous soluble CD33 M ectodomain. Right : the putative binding of CD33 MΔ4BP (or speculatively sCD33 M ) to the extracellular domains of CD33 M or CD33 m . The CD33 MΔ4BP :CD33 M binding site is not defined., but could potentially recreate a dimeric ligand pocket with CD33 M monomers, and a monomeric ligand pocket with CD33 m .

    Article Snippet: In the first antibody incubation, rabbit anti-human CD33 (Bioss, bs-2042R, 1:400) and mouse anti-human SHP-1 (Thermo Scientific, MA5-38614, 1: 400), were performed overnight at 4°C.

    Techniques: Western Blot, Binding Assay

    Left : endogenous CD33 M co-immunoprecipitates sialylated CLU, but not desialylated CLU in U937 cells. Representative western blot for . Top blot : representative western blots of anti-CD33 co-immunoprecipitation products, blotted with anti- CLU antibodies. Lower blot : anti-CD33 co-immunoprecipitation products probed with anti-CD33 antibody, showing equivalent pulldown. This data is quantified in , left panel. Each lane shown represents one independent biological replication of the respective condition. Right : exogenous CD33 M but not CD33 m co-immunoprecipitates with CLU in HEK293 cells. Representative western blot for . Top panel: Representative western blots showing co-precipitation of CLU with CD33 M in HEK293 cells expressing CD33 M only (CD33 M /CD33 M dimers), or in HEK293 cells expressing both CD33 M and CD33 m (CD33 M /CD33 M ; CD33 M /C D33 m or CD33 m /CD33 m dimers) (CLU does not co-precipitate with CD33 in cells expressing only CD33 m ). Top blot : anti-HA pulldown probed with anti-CLU antibody. Middle blot : same IP products probed with anti-HA antibody. Lower blot : Protein input before precipitation probed with anti-CD33 antibody. This data is quantified in . In , the data for HEK293 cells expressing both CD33M and CD33m is displayed in the third column is the ratio of CLU immunoreactive band intensities versus just the CD33M band intensity. In the fourth column, the same CLU immunoreactive band intensity is expressed as the ratio of the cumulative band intensities as measured by HA immunoreactivity for both CD33m and CD33M isoforms.Each lane shown represents one independent biological replication of the respective condition.

    Journal: bioRxiv

    Article Title: CD33 and clusterin interact biophysically and genetically to modulate Alzheimer risk

    doi: 10.1101/2025.07.29.667318

    Figure Lengend Snippet: Left : endogenous CD33 M co-immunoprecipitates sialylated CLU, but not desialylated CLU in U937 cells. Representative western blot for . Top blot : representative western blots of anti-CD33 co-immunoprecipitation products, blotted with anti- CLU antibodies. Lower blot : anti-CD33 co-immunoprecipitation products probed with anti-CD33 antibody, showing equivalent pulldown. This data is quantified in , left panel. Each lane shown represents one independent biological replication of the respective condition. Right : exogenous CD33 M but not CD33 m co-immunoprecipitates with CLU in HEK293 cells. Representative western blot for . Top panel: Representative western blots showing co-precipitation of CLU with CD33 M in HEK293 cells expressing CD33 M only (CD33 M /CD33 M dimers), or in HEK293 cells expressing both CD33 M and CD33 m (CD33 M /CD33 M ; CD33 M /C D33 m or CD33 m /CD33 m dimers) (CLU does not co-precipitate with CD33 in cells expressing only CD33 m ). Top blot : anti-HA pulldown probed with anti-CLU antibody. Middle blot : same IP products probed with anti-HA antibody. Lower blot : Protein input before precipitation probed with anti-CD33 antibody. This data is quantified in . In , the data for HEK293 cells expressing both CD33M and CD33m is displayed in the third column is the ratio of CLU immunoreactive band intensities versus just the CD33M band intensity. In the fourth column, the same CLU immunoreactive band intensity is expressed as the ratio of the cumulative band intensities as measured by HA immunoreactivity for both CD33m and CD33M isoforms.Each lane shown represents one independent biological replication of the respective condition.

    Article Snippet: In the first antibody incubation, rabbit anti-human CD33 (Bioss, bs-2042R, 1:400) and mouse anti-human SHP-1 (Thermo Scientific, MA5-38614, 1: 400), were performed overnight at 4°C.

    Techniques: Western Blot, Immunoprecipitation, Expressing

    Co-IP studies on lysates from HEK293 cells expressing similar quantities of CD33 M ( bottom panel ) reveal that much less CLU ( top panel ) is co-precipitated with the CD33 M 5X dimer interface mutant than with wild type CD33 M . This is a representative blot for data for multiple biologica; replicates and is quantified in . Each lane shown represents one independent biological replication of the respective condition

    Journal: bioRxiv

    Article Title: CD33 and clusterin interact biophysically and genetically to modulate Alzheimer risk

    doi: 10.1101/2025.07.29.667318

    Figure Lengend Snippet: Co-IP studies on lysates from HEK293 cells expressing similar quantities of CD33 M ( bottom panel ) reveal that much less CLU ( top panel ) is co-precipitated with the CD33 M 5X dimer interface mutant than with wild type CD33 M . This is a representative blot for data for multiple biologica; replicates and is quantified in . Each lane shown represents one independent biological replication of the respective condition

    Article Snippet: In the first antibody incubation, rabbit anti-human CD33 (Bioss, bs-2042R, 1:400) and mouse anti-human SHP-1 (Thermo Scientific, MA5-38614, 1: 400), were performed overnight at 4°C.

    Techniques: Co-Immunoprecipitation Assay, Expressing, Mutagenesis

    BLI response curves representing the association (0-60 s) and dissociation (60-90 s) of CD33 M ectodomain (ECD) WT (left panel) or R119A (right panel) in the concentration range of 15.6-250 µM with the 3’-sialyllactose-sp-biotin immobilized on the Super Streptavidin biosensors. Binding curves analysis using a 1:2 bivalent analyte model revealed that the dimer of CD33 M ECD WT binds to 3’-syalyllactose with dissociation constants 6.13 ± 0.25 mM (mean ± SEM). CD33 M ECD R119A showed no detectable binding in the same concentration range with WT.

    Journal: bioRxiv

    Article Title: CD33 and clusterin interact biophysically and genetically to modulate Alzheimer risk

    doi: 10.1101/2025.07.29.667318

    Figure Lengend Snippet: BLI response curves representing the association (0-60 s) and dissociation (60-90 s) of CD33 M ectodomain (ECD) WT (left panel) or R119A (right panel) in the concentration range of 15.6-250 µM with the 3’-sialyllactose-sp-biotin immobilized on the Super Streptavidin biosensors. Binding curves analysis using a 1:2 bivalent analyte model revealed that the dimer of CD33 M ECD WT binds to 3’-syalyllactose with dissociation constants 6.13 ± 0.25 mM (mean ± SEM). CD33 M ECD R119A showed no detectable binding in the same concentration range with WT.

    Article Snippet: In the first antibody incubation, rabbit anti-human CD33 (Bioss, bs-2042R, 1:400) and mouse anti-human SHP-1 (Thermo Scientific, MA5-38614, 1: 400), were performed overnight at 4°C.

    Techniques: Concentration Assay, Binding Assay

    Binding analysis by microscale thermophoresis measuring the change in the fluorescence intensity of fluorescently labeled deglycosylated CD33 ECD (initial fluorescence)

    Journal: bioRxiv

    Article Title: CD33 and clusterin interact biophysically and genetically to modulate Alzheimer risk

    doi: 10.1101/2025.07.29.667318

    Figure Lengend Snippet: Binding analysis by microscale thermophoresis measuring the change in the fluorescence intensity of fluorescently labeled deglycosylated CD33 ECD (initial fluorescence)

    Article Snippet: In the first antibody incubation, rabbit anti-human CD33 (Bioss, bs-2042R, 1:400) and mouse anti-human SHP-1 (Thermo Scientific, MA5-38614, 1: 400), were performed overnight at 4°C.

    Techniques: Binding Assay, Microscale Thermophoresis, Fluorescence, Labeling

    Far UV circular dichroism spectra for wild type CD33 M ectodomain (black) and R119A mutant CD33 M ectodomain (red) reveal similar folding states, indicating that the loss of sialic acid binding by the R119A protein is due to an authentic effect on ligand binding, rather than due to simple misfolding of the R119A mutant protein.. Spectra were recorded at 4°C with CD33 ECD at 0.2 mg/ml in 20 mM HEPES, 200 mM NaCl, pH7.5.

    Journal: bioRxiv

    Article Title: CD33 and clusterin interact biophysically and genetically to modulate Alzheimer risk

    doi: 10.1101/2025.07.29.667318

    Figure Lengend Snippet: Far UV circular dichroism spectra for wild type CD33 M ectodomain (black) and R119A mutant CD33 M ectodomain (red) reveal similar folding states, indicating that the loss of sialic acid binding by the R119A protein is due to an authentic effect on ligand binding, rather than due to simple misfolding of the R119A mutant protein.. Spectra were recorded at 4°C with CD33 ECD at 0.2 mg/ml in 20 mM HEPES, 200 mM NaCl, pH7.5.

    Article Snippet: In the first antibody incubation, rabbit anti-human CD33 (Bioss, bs-2042R, 1:400) and mouse anti-human SHP-1 (Thermo Scientific, MA5-38614, 1: 400), were performed overnight at 4°C.

    Techniques: Circular Dichroism, Mutagenesis, Binding Assay, Ligand Binding Assay

    a. In situ Proximity ligation assay for CD33-bound CLU on IBA-1 positive microglial cells in post-mortem human AD brain . Representative confocal microscopy images showing CD33:CLU PLA signals in microglia close to amyloid plaques in human AD brain cortex (63x, scale bar = 50 µm). An enlarged view of the PLA signal is shown in the upper right panel. FFPE sections were stained for 6E10 Aβ = violet; IBA1 microglia = green; PLA = red; and DAPI nucleus = blue. b. Dot plot showing In vivo correlations between microglial CD33:CLU PLA signal intensity and the distance of the microglial cell from Aβ plaque. The proportion of CD33-CLU positive pixels for each IBA-1 positive microglial cell was plotted relative to the distance of that cell from the edge of Aβ plaque (r 2 = 0.6235). There was a negative correlation between distance from the plaque edge and the proportion of CD33-CLU PLA positive pixels in microglia in human AD brain (spearman r = -0.739, p < 0.0001, n = 29 microglia from n = 2 independent AD affected brains). c. More endogenous CLU can be co-immunoprecipitated with endogenous CD33 from human AD brain than from control brain. The graph shows quantification of CLU:CD33 co-immunoprecipitation (CD33-bound CLU) in brain lysates from AD cases (n = 3), but only weak CLU:CD33 co-immunoprecipitation is seen in brain lysates from control cases (n = 3). Representative co-IP western blot of lysates and anti-CD33 co-immunoprecipitation products probed with anti-CLU antibodies is observed in . *** = p < 0.001; ANOVA; error bars = mean ± SEM; n = 3 independent samples. Because both CLU and CD33 levels are highly variable in post-mortem tissue, brains were selected based on equal expression levels of both CLU and CD33 from a panel of n=53 control and AD cerebral cortices. d. Native human CLU (either alone or complexed with Aβ1-42 oligomers) also binds exogenous human CD33 M on transfected HEK293 cells. The graph shows quantification of CLU:CD33 co-IP products (CD33-bound CLU). A representative co-IP western blot is shown in , right panel. There is no significant difference in the amount of CLU bound to CD33M in lysates from HEK293 cells expressing exogenous CD33M and exposed to CLU alone versus CLU plus Aβ oligomers. NS = not significant; Student t-test; error bars = mean ± SEM CLU: 1.145± 0.0904; CLU+Aβ1-42: 1.379± 0.0798; n = 3. Each dot represents one independent biological replication of the respective condition e. Native human CLU (either alone or complexed with Aβ1-42 oligomers) also binds endogenous human CD33 M physiologically expressed on U937 cells . Representative co-IP western blot is shown in , left panel. There is no significant difference in the amount of CD33-bound CLU in lysates from U937 cells exposed to CLU alone versus CLU plus Aβ oligomers NS = not significant; Student t-test; error bars = mean ± SEM; CLU: 0.928± 0.06; CLU+Aβ1-42: 0.881± 0.0491; n = 6. Each dot represents one independent biological replication of the respective condition.

    Journal: bioRxiv

    Article Title: CD33 and clusterin interact biophysically and genetically to modulate Alzheimer risk

    doi: 10.1101/2025.07.29.667318

    Figure Lengend Snippet: a. In situ Proximity ligation assay for CD33-bound CLU on IBA-1 positive microglial cells in post-mortem human AD brain . Representative confocal microscopy images showing CD33:CLU PLA signals in microglia close to amyloid plaques in human AD brain cortex (63x, scale bar = 50 µm). An enlarged view of the PLA signal is shown in the upper right panel. FFPE sections were stained for 6E10 Aβ = violet; IBA1 microglia = green; PLA = red; and DAPI nucleus = blue. b. Dot plot showing In vivo correlations between microglial CD33:CLU PLA signal intensity and the distance of the microglial cell from Aβ plaque. The proportion of CD33-CLU positive pixels for each IBA-1 positive microglial cell was plotted relative to the distance of that cell from the edge of Aβ plaque (r 2 = 0.6235). There was a negative correlation between distance from the plaque edge and the proportion of CD33-CLU PLA positive pixels in microglia in human AD brain (spearman r = -0.739, p < 0.0001, n = 29 microglia from n = 2 independent AD affected brains). c. More endogenous CLU can be co-immunoprecipitated with endogenous CD33 from human AD brain than from control brain. The graph shows quantification of CLU:CD33 co-immunoprecipitation (CD33-bound CLU) in brain lysates from AD cases (n = 3), but only weak CLU:CD33 co-immunoprecipitation is seen in brain lysates from control cases (n = 3). Representative co-IP western blot of lysates and anti-CD33 co-immunoprecipitation products probed with anti-CLU antibodies is observed in . *** = p < 0.001; ANOVA; error bars = mean ± SEM; n = 3 independent samples. Because both CLU and CD33 levels are highly variable in post-mortem tissue, brains were selected based on equal expression levels of both CLU and CD33 from a panel of n=53 control and AD cerebral cortices. d. Native human CLU (either alone or complexed with Aβ1-42 oligomers) also binds exogenous human CD33 M on transfected HEK293 cells. The graph shows quantification of CLU:CD33 co-IP products (CD33-bound CLU). A representative co-IP western blot is shown in , right panel. There is no significant difference in the amount of CLU bound to CD33M in lysates from HEK293 cells expressing exogenous CD33M and exposed to CLU alone versus CLU plus Aβ oligomers. NS = not significant; Student t-test; error bars = mean ± SEM CLU: 1.145± 0.0904; CLU+Aβ1-42: 1.379± 0.0798; n = 3. Each dot represents one independent biological replication of the respective condition e. Native human CLU (either alone or complexed with Aβ1-42 oligomers) also binds endogenous human CD33 M physiologically expressed on U937 cells . Representative co-IP western blot is shown in , left panel. There is no significant difference in the amount of CD33-bound CLU in lysates from U937 cells exposed to CLU alone versus CLU plus Aβ oligomers NS = not significant; Student t-test; error bars = mean ± SEM; CLU: 0.928± 0.06; CLU+Aβ1-42: 0.881± 0.0491; n = 6. Each dot represents one independent biological replication of the respective condition.

    Article Snippet: In the first antibody incubation, rabbit anti-human CD33 (Bioss, bs-2042R, 1:400) and mouse anti-human SHP-1 (Thermo Scientific, MA5-38614, 1: 400), were performed overnight at 4°C.

    Techniques: In Situ, Proximity Ligation Assay, Confocal Microscopy, Staining, In Vivo, Immunoprecipitation, Control, Co-Immunoprecipitation Assay, Western Blot, Expressing, Transfection

    Representative Western blot for . Co-IP studies on lysates from HEK293 cells expressing similar quantities of CD33 M ( bottom panel ) reveal that much less CLU ( top panel ) is co-precipitated with the CD33 M 5X dimer interface mutant than with wild type CD33 M . This data is quantified in Extended Data Figure 3D. Right panel; quantification. *** p<0.00001, error bars = mean ± SEM CD33 M : 0.425±0.0073; CD33 M 5X: 0.012±0.006; n = 5 replications. Each lane represents one independent biological replication of the respective condition.

    Journal: bioRxiv

    Article Title: CD33 and clusterin interact biophysically and genetically to modulate Alzheimer risk

    doi: 10.1101/2025.07.29.667318

    Figure Lengend Snippet: Representative Western blot for . Co-IP studies on lysates from HEK293 cells expressing similar quantities of CD33 M ( bottom panel ) reveal that much less CLU ( top panel ) is co-precipitated with the CD33 M 5X dimer interface mutant than with wild type CD33 M . This data is quantified in Extended Data Figure 3D. Right panel; quantification. *** p<0.00001, error bars = mean ± SEM CD33 M : 0.425±0.0073; CD33 M 5X: 0.012±0.006; n = 5 replications. Each lane represents one independent biological replication of the respective condition.

    Article Snippet: In the first antibody incubation, rabbit anti-human CD33 (Bioss, bs-2042R, 1:400) and mouse anti-human SHP-1 (Thermo Scientific, MA5-38614, 1: 400), were performed overnight at 4°C.

    Techniques: Western Blot, Co-Immunoprecipitation Assay, Expressing, Mutagenesis

    A. Binding curves of clusterin/Aβ42 mixture (left panel) or Aβ42 (right panel). Each binding curve is the average of four independent measurements. Clusterin and Aβ42 concentrations are indicated. B. Steady-state BLI analysis of the clusterin/Aβ42 mixture (red square) or Aβ42 (blue diamond) binding to CD33 M ECD. Error bars represent SD. C. The bar chart of each data point presented in B. Error bars represent SD. Statistical analysis was performed using two-way ANOVA followed by Bonferroni’s multiple comparison test (n = 4, * p <0.05, ** p <0.01 vs clusterin alone).

    Journal: bioRxiv

    Article Title: CD33 and clusterin interact biophysically and genetically to modulate Alzheimer risk

    doi: 10.1101/2025.07.29.667318

    Figure Lengend Snippet: A. Binding curves of clusterin/Aβ42 mixture (left panel) or Aβ42 (right panel). Each binding curve is the average of four independent measurements. Clusterin and Aβ42 concentrations are indicated. B. Steady-state BLI analysis of the clusterin/Aβ42 mixture (red square) or Aβ42 (blue diamond) binding to CD33 M ECD. Error bars represent SD. C. The bar chart of each data point presented in B. Error bars represent SD. Statistical analysis was performed using two-way ANOVA followed by Bonferroni’s multiple comparison test (n = 4, * p <0.05, ** p <0.01 vs clusterin alone).

    Article Snippet: In the first antibody incubation, rabbit anti-human CD33 (Bioss, bs-2042R, 1:400) and mouse anti-human SHP-1 (Thermo Scientific, MA5-38614, 1: 400), were performed overnight at 4°C.

    Techniques: Binding Assay, Comparison

    a. Human plasma CLU alone, and especially human CLU + Aβ oligomers induce ITIM tyrosine phosphorylation of endogenous CD33 (left panel) and recruitment of endogenous SHP-1 (right panel) in human monocytic U937 cells. Quantification of CD33 phosphotyrosine (pY20 antibody immunoreactive anti-CD33 IP products) and of SHP-1 recruitment (anti-SHP-1 immunoreactive anti-CD33 IP products) using band intensity (representative blots are in . * = p <0.05; *** = p <0.001; NS = not significant; ANOVA with Tukey post-hoc correction; error bars = mean ± SEM; For CD33 M -pTyr, No treatment: 1.00±0.0; Aβ treatment: 1.367±0.4107; CLU treatment: 6.283±1.667; CLU + Aβ treatment: 11.92±1.116; For SHP-1, No treatment: 1.00±0.0; Aβ treatment: 1.447±0.2726; CLU treatment: 2.589±0.0688; CLU + Aβ treatment: 4.362±0.5971, n ≥ 3 independent biological replications. b. Recombinant human clusterin (rCLU) and native human plasma clusterin (pCLU), but not desialylated clusterin (desCLU) equivalently activate CD33 ITIM phosphorylation and SHP-1 recruitment in HEK293 cells . CD33 tyrosine phosphorylation and SHP-1 recruitment were measured by western blots band intensity ratios for pY20-phosphotyrosine immunoreactive CD33 versus total CD33 by co-IP western blots. with different cell lines are available in . c. CLU + Aβ induces greater CD33 ITIM phosphorylation than CLU alone, but only in CD33M expressing cells. Quantification of western blots of anti-CD33 immunoprecipitates probed with pY20 anti-phosphotyrosine or anti-HA antibodies reveals that treatment with CLU alone, and especially treatment with CLU + Aβ oligomers, increases CD33 tyrosine phosphorylation in cells expressing either CD33M only or CD33 M plus CD33 m . No CD33 phosphorylation was observed in cells expressing only CD33 m , and very little in CD33 M-5X cells. n = 3 replications. Representative western blots are in . d. CLU + Aβ induces greater CD33 SHP-1 recruitment than CLU alone, but only in CD33M expressing cells. Quantification of western blots of anti-CD33 immunoprecipitates probed with SHP-1 or anti-HA antibodies reveals that treatment with CLU alone, and especially treatment with CLU + Aβ oligomers, increases SHP-1 recruitment in cells expressing either CD33M only or CD33 M plus CD33 m . No SHP-1 recruitment was observed in cells expressing only CD33 m , and very little in CD33 M-5X cells. n = 3 replications. Representative western blots are in . e. Treatment of human monocytes with 0.06 µM CLU for 15 min at 37°C increases binding of CD33 and SHP-1. Human monocytes (genotype CD33 rs3865444 CC ) were treated with CLU and then a proximity ligation assay (PLA) was performed to examine CD33-SHP-1 interaction. Median fluorescence intensity of the PLA of CD33-SHP-1 was measured and analyzed in relation to untreated monocytes from the same individuals. Data were analyzed using paired t-test on GraphPad Prism. *, p<0.05. f. CD33 rs3865444 CC risk genotype-dependent effect of CLUon monomeric Aβ1-42 uptake by human monocytes. Human monocytes (genotype CD33 rs3865444 CC ) were treated with either CLU or desCLU, and the effect on Aβ1-42 uptake was assessed by flow cytometry. CLU significantly reduces the Aβ 1-42 uptake compared to the media control or desCLU treatment. Data were analyzed using geometric mean intensity of HiLyte™ Fluor 647 conjugated Aβ 1-42, n = 10 unrelated donors each examined once. Each dot represents an individual donor. Data were analyzed using ANOVA on GraphPad Prism. **, p<0.01; *, p<0.05.

    Journal: bioRxiv

    Article Title: CD33 and clusterin interact biophysically and genetically to modulate Alzheimer risk

    doi: 10.1101/2025.07.29.667318

    Figure Lengend Snippet: a. Human plasma CLU alone, and especially human CLU + Aβ oligomers induce ITIM tyrosine phosphorylation of endogenous CD33 (left panel) and recruitment of endogenous SHP-1 (right panel) in human monocytic U937 cells. Quantification of CD33 phosphotyrosine (pY20 antibody immunoreactive anti-CD33 IP products) and of SHP-1 recruitment (anti-SHP-1 immunoreactive anti-CD33 IP products) using band intensity (representative blots are in . * = p <0.05; *** = p <0.001; NS = not significant; ANOVA with Tukey post-hoc correction; error bars = mean ± SEM; For CD33 M -pTyr, No treatment: 1.00±0.0; Aβ treatment: 1.367±0.4107; CLU treatment: 6.283±1.667; CLU + Aβ treatment: 11.92±1.116; For SHP-1, No treatment: 1.00±0.0; Aβ treatment: 1.447±0.2726; CLU treatment: 2.589±0.0688; CLU + Aβ treatment: 4.362±0.5971, n ≥ 3 independent biological replications. b. Recombinant human clusterin (rCLU) and native human plasma clusterin (pCLU), but not desialylated clusterin (desCLU) equivalently activate CD33 ITIM phosphorylation and SHP-1 recruitment in HEK293 cells . CD33 tyrosine phosphorylation and SHP-1 recruitment were measured by western blots band intensity ratios for pY20-phosphotyrosine immunoreactive CD33 versus total CD33 by co-IP western blots. with different cell lines are available in . c. CLU + Aβ induces greater CD33 ITIM phosphorylation than CLU alone, but only in CD33M expressing cells. Quantification of western blots of anti-CD33 immunoprecipitates probed with pY20 anti-phosphotyrosine or anti-HA antibodies reveals that treatment with CLU alone, and especially treatment with CLU + Aβ oligomers, increases CD33 tyrosine phosphorylation in cells expressing either CD33M only or CD33 M plus CD33 m . No CD33 phosphorylation was observed in cells expressing only CD33 m , and very little in CD33 M-5X cells. n = 3 replications. Representative western blots are in . d. CLU + Aβ induces greater CD33 SHP-1 recruitment than CLU alone, but only in CD33M expressing cells. Quantification of western blots of anti-CD33 immunoprecipitates probed with SHP-1 or anti-HA antibodies reveals that treatment with CLU alone, and especially treatment with CLU + Aβ oligomers, increases SHP-1 recruitment in cells expressing either CD33M only or CD33 M plus CD33 m . No SHP-1 recruitment was observed in cells expressing only CD33 m , and very little in CD33 M-5X cells. n = 3 replications. Representative western blots are in . e. Treatment of human monocytes with 0.06 µM CLU for 15 min at 37°C increases binding of CD33 and SHP-1. Human monocytes (genotype CD33 rs3865444 CC ) were treated with CLU and then a proximity ligation assay (PLA) was performed to examine CD33-SHP-1 interaction. Median fluorescence intensity of the PLA of CD33-SHP-1 was measured and analyzed in relation to untreated monocytes from the same individuals. Data were analyzed using paired t-test on GraphPad Prism. *, p<0.05. f. CD33 rs3865444 CC risk genotype-dependent effect of CLUon monomeric Aβ1-42 uptake by human monocytes. Human monocytes (genotype CD33 rs3865444 CC ) were treated with either CLU or desCLU, and the effect on Aβ1-42 uptake was assessed by flow cytometry. CLU significantly reduces the Aβ 1-42 uptake compared to the media control or desCLU treatment. Data were analyzed using geometric mean intensity of HiLyte™ Fluor 647 conjugated Aβ 1-42, n = 10 unrelated donors each examined once. Each dot represents an individual donor. Data were analyzed using ANOVA on GraphPad Prism. **, p<0.01; *, p<0.05.

    Article Snippet: In the first antibody incubation, rabbit anti-human CD33 (Bioss, bs-2042R, 1:400) and mouse anti-human SHP-1 (Thermo Scientific, MA5-38614, 1: 400), were performed overnight at 4°C.

    Techniques: Clinical Proteomics, Phospho-proteomics, Recombinant, Western Blot, Co-Immunoprecipitation Assay, Expressing, Binding Assay, Proximity Ligation Assay, Fluorescence, Flow Cytometry, Control

    Representative blot of n ≥ 3 independent biological replications for the graph in , showing that human plasma CLU alone, and especially human CLU + Aβ oligomers induce ITIM tyrosine phosphorylation of endogenous CD33 (top panel) and recruitment of endogenous SHP-1 (middle panel) in human monocytic U937 cells.

    Journal: bioRxiv

    Article Title: CD33 and clusterin interact biophysically and genetically to modulate Alzheimer risk

    doi: 10.1101/2025.07.29.667318

    Figure Lengend Snippet: Representative blot of n ≥ 3 independent biological replications for the graph in , showing that human plasma CLU alone, and especially human CLU + Aβ oligomers induce ITIM tyrosine phosphorylation of endogenous CD33 (top panel) and recruitment of endogenous SHP-1 (middle panel) in human monocytic U937 cells.

    Article Snippet: In the first antibody incubation, rabbit anti-human CD33 (Bioss, bs-2042R, 1:400) and mouse anti-human SHP-1 (Thermo Scientific, MA5-38614, 1: 400), were performed overnight at 4°C.

    Techniques: Clinical Proteomics, Phospho-proteomics

    Representative western blot from n = 3 independent biological replications for . CLU + Aβ induces greater CD33 ITIM phosphorylation (top panel) and SHP-1 recruitment (bottom panel) than CLU alone, but only in CD33M expressing cells. Quantification of western blots of anti-CD33 immunoprecipitates probed with pY20 anti-phosphotyrosine, SHP-1 or anti-HA antibodies reveals that treatment with CLU alone, and especially treatment with CLU + Aβ oligomers, increases CD33 tyrosine phosphorylation and SHP-1 recruitment in cells expressing either CD33M only or CD33M plus CD33 m . No CD33 phosphorylation or SHP-1 recruitment was observed in cells expressing only CD33m, and very little in CD33M 5X cells. n = 3 replications.

    Journal: bioRxiv

    Article Title: CD33 and clusterin interact biophysically and genetically to modulate Alzheimer risk

    doi: 10.1101/2025.07.29.667318

    Figure Lengend Snippet: Representative western blot from n = 3 independent biological replications for . CLU + Aβ induces greater CD33 ITIM phosphorylation (top panel) and SHP-1 recruitment (bottom panel) than CLU alone, but only in CD33M expressing cells. Quantification of western blots of anti-CD33 immunoprecipitates probed with pY20 anti-phosphotyrosine, SHP-1 or anti-HA antibodies reveals that treatment with CLU alone, and especially treatment with CLU + Aβ oligomers, increases CD33 tyrosine phosphorylation and SHP-1 recruitment in cells expressing either CD33M only or CD33M plus CD33 m . No CD33 phosphorylation or SHP-1 recruitment was observed in cells expressing only CD33m, and very little in CD33M 5X cells. n = 3 replications.

    Article Snippet: In the first antibody incubation, rabbit anti-human CD33 (Bioss, bs-2042R, 1:400) and mouse anti-human SHP-1 (Thermo Scientific, MA5-38614, 1: 400), were performed overnight at 4°C.

    Techniques: Western Blot, Phospho-proteomics, Expressing

    a. Compared to monocytes from human CD33 “AA” protective allele carriers, monocytes from CD33 “CC” risk allele carriers have reduced clearance of human amyloid plaques in ex vivo brain slices from 5XFAD transgenic human APP mice. Serial sections of unfixed brain from 5XFAD mice were incubated 48 hours with medium only, or with medium plus PBMCs from AA (protective) or CC (risk) allele carriers. Plaques were quantified by anti-Aβ immunofluorescent staining. The results were expressed as plaque number (i), brain area covered by plaques (ii) and plaque size (iii). The results were normalised to the results for medium only. N = 10 independent replications. ***p<0.001, *p<0.05; unpaired student’s t-test; error bars = mean ± SEM. Representative images are in . b. Human U937 monocytic cells clear amyloid plaques from ex vivo brain slices, and this is impaired by CLU. Clearance of Aβ plaques from three serial sections of unfixed 5XFAD brain was quantified by immunofluorescent staining of hippocampal Aβ plaques following 48h incubation with medium only, with U937 cells only, or U937 cells + CLU. Results are expressed as number of plaques (i) or area covered by Aβ (ii), and were normalised to the result for slices exposed to medium only. *p<0.05, **p< 0.01, ***p<0.001; unpaired student’s t-test; error bars = mean ± SEM n = 8 replications. Representative images are in . c. Compared to CLU, desCLU does not downregulate clearance of Aβ plaques by human U937 monocytic cells. Clearance of Abeta plaques was quantified by immunofluorescent staining of hippocampal Aβ plaques in three serial sections from 5XFAD brain following 48h incubation with medium only, with U937 cells plus medium containing desCLU, or with U937 cells plus medium containing CLU. Results are expressed as number of plaques (i) or area covered by Aβ (ii) and representative images are in . *p<0.05, **p<0.01, ***p<0.001, one-way ANOVA Tukey’s multiple comparisons test; error bars = mean ± SEM, n = 10 replications.

    Journal: bioRxiv

    Article Title: CD33 and clusterin interact biophysically and genetically to modulate Alzheimer risk

    doi: 10.1101/2025.07.29.667318

    Figure Lengend Snippet: a. Compared to monocytes from human CD33 “AA” protective allele carriers, monocytes from CD33 “CC” risk allele carriers have reduced clearance of human amyloid plaques in ex vivo brain slices from 5XFAD transgenic human APP mice. Serial sections of unfixed brain from 5XFAD mice were incubated 48 hours with medium only, or with medium plus PBMCs from AA (protective) or CC (risk) allele carriers. Plaques were quantified by anti-Aβ immunofluorescent staining. The results were expressed as plaque number (i), brain area covered by plaques (ii) and plaque size (iii). The results were normalised to the results for medium only. N = 10 independent replications. ***p<0.001, *p<0.05; unpaired student’s t-test; error bars = mean ± SEM. Representative images are in . b. Human U937 monocytic cells clear amyloid plaques from ex vivo brain slices, and this is impaired by CLU. Clearance of Aβ plaques from three serial sections of unfixed 5XFAD brain was quantified by immunofluorescent staining of hippocampal Aβ plaques following 48h incubation with medium only, with U937 cells only, or U937 cells + CLU. Results are expressed as number of plaques (i) or area covered by Aβ (ii), and were normalised to the result for slices exposed to medium only. *p<0.05, **p< 0.01, ***p<0.001; unpaired student’s t-test; error bars = mean ± SEM n = 8 replications. Representative images are in . c. Compared to CLU, desCLU does not downregulate clearance of Aβ plaques by human U937 monocytic cells. Clearance of Abeta plaques was quantified by immunofluorescent staining of hippocampal Aβ plaques in three serial sections from 5XFAD brain following 48h incubation with medium only, with U937 cells plus medium containing desCLU, or with U937 cells plus medium containing CLU. Results are expressed as number of plaques (i) or area covered by Aβ (ii) and representative images are in . *p<0.05, **p<0.01, ***p<0.001, one-way ANOVA Tukey’s multiple comparisons test; error bars = mean ± SEM, n = 10 replications.

    Article Snippet: In the first antibody incubation, rabbit anti-human CD33 (Bioss, bs-2042R, 1:400) and mouse anti-human SHP-1 (Thermo Scientific, MA5-38614, 1: 400), were performed overnight at 4°C.

    Techniques: Ex Vivo, Transgenic Assay, Incubation, Staining

    Human monocytes from CD33 “CC” risk allele carriers have reduced clearance of human amyloid plaques in ex vivo brain slices compared to monocytes from CD33 “AA” protective allele carriers. Representative figures quantified in of clearance of hippocampal Aβ plaques by human monocytes following incubation on serial sections of unfixed brain from 5XFAD mice. Immunofluorescent staining of hippocampal Aβ plaques (green) following 48h incubation with medium only with no cells ( left ) or with CC (risk allele) genotype monocytes ( middle ) or with AA (protective allele) monocytes ( right ). N = 10 independent replications). DAPI blue = nuclei.

    Journal: bioRxiv

    Article Title: CD33 and clusterin interact biophysically and genetically to modulate Alzheimer risk

    doi: 10.1101/2025.07.29.667318

    Figure Lengend Snippet: Human monocytes from CD33 “CC” risk allele carriers have reduced clearance of human amyloid plaques in ex vivo brain slices compared to monocytes from CD33 “AA” protective allele carriers. Representative figures quantified in of clearance of hippocampal Aβ plaques by human monocytes following incubation on serial sections of unfixed brain from 5XFAD mice. Immunofluorescent staining of hippocampal Aβ plaques (green) following 48h incubation with medium only with no cells ( left ) or with CC (risk allele) genotype monocytes ( middle ) or with AA (protective allele) monocytes ( right ). N = 10 independent replications). DAPI blue = nuclei.

    Article Snippet: In the first antibody incubation, rabbit anti-human CD33 (Bioss, bs-2042R, 1:400) and mouse anti-human SHP-1 (Thermo Scientific, MA5-38614, 1: 400), were performed overnight at 4°C.

    Techniques: Ex Vivo, Incubation, Staining

    Journal: bioRxiv

    Article Title: CD33 and clusterin interact biophysically and genetically to modulate Alzheimer risk

    doi: 10.1101/2025.07.29.667318

    Figure Lengend Snippet:

    Article Snippet: In the first antibody incubation, rabbit anti-human CD33 (Bioss, bs-2042R, 1:400) and mouse anti-human SHP-1 (Thermo Scientific, MA5-38614, 1: 400), were performed overnight at 4°C.

    Techniques: Gene Expression, RNA Expression, Expressing

    Treatment of Human monocytes with 0.06 µM CLU for 15 min at 37°C increases tyrosine phosphorylation of the ITIM domain on endogenous CD33M. Quantitative western blots of lysates for human blood monocytes reveal that monocytes from homozygous carriers of the rs3865444 AA reference /non-risk allele (gray dots) express less total CD33 and less CD33M than do homozygous carriers of the rs3865444 CC risk allele (black dots) ( Left panels ). Treatment of human monocytes with 0.06 µM CLU for 15 min at 37°C increases tyrosine phosphorylation of the ITIM domain on endogenous CD33M both in individuals homozygous for the rs3865444 CC risk allele (black dots) and in individuals homozygous for the rs3865444 AA reference /non-risk allele (gray dots) paired t-test, p=0.007 (2 nd left panel). NB: As demonstrated in the left panel, carriers of the rs3865444 CC risk allele express much more CD33M than do carriers of the rs3865444 AA reference allele. However, when equal quantities of CD33M protein are loaded onto these blots to facilitate comparison of basal and CLU-induced CD33 ITIM phosphorylation, the specific activity of CD33M signaling is the same. Representative Western blots for Supplemental Figure 5F. Treatment of Human monocytes with 0.06 µM CLU for 15 min at 37°C increases tyrosine phosphorylation of the ITIM domain on endogenous CD33M. Middle panel : Quantitative western blots of lysates for human blood monocytes reveal that monocytes from homozygous carriers of the rs3865444 AA reference express less total CD33 and less CD33M than do homozygous carriers of the rs3865444 CC risk allele. Right panel : Representative western blots showing that treatment of human monocytes with 0.06 µM CLU for 15 min at 37°C increases tyrosine phosphorylation of the ITIM domain on endogenous CD33M both in individuals homozygous for the rs3865444 CC risk allele (person 2) and in individuals homozygous for the rs3865444 AA reference /nonrisk allele (person 1). Representative western blots are available in Extended Data Figure 5C-G. NB: As demonstrated in the left panel, carriers of the rs3865444 CC risk allele express much more CD33M than do carriers of the rs3865444 AA reference allele. However, when equal quantities of CD33M protein are loaded (bottom right panel) onto these blots to facilitate comparison of basal and CLU-induced CD33 ITIM phosphorylation, the specific activity of CD33M signaling is the same.

    Journal: bioRxiv

    Article Title: CD33 and clusterin interact biophysically and genetically to modulate Alzheimer risk

    doi: 10.1101/2025.07.29.667318

    Figure Lengend Snippet: Treatment of Human monocytes with 0.06 µM CLU for 15 min at 37°C increases tyrosine phosphorylation of the ITIM domain on endogenous CD33M. Quantitative western blots of lysates for human blood monocytes reveal that monocytes from homozygous carriers of the rs3865444 AA reference /non-risk allele (gray dots) express less total CD33 and less CD33M than do homozygous carriers of the rs3865444 CC risk allele (black dots) ( Left panels ). Treatment of human monocytes with 0.06 µM CLU for 15 min at 37°C increases tyrosine phosphorylation of the ITIM domain on endogenous CD33M both in individuals homozygous for the rs3865444 CC risk allele (black dots) and in individuals homozygous for the rs3865444 AA reference /non-risk allele (gray dots) paired t-test, p=0.007 (2 nd left panel). NB: As demonstrated in the left panel, carriers of the rs3865444 CC risk allele express much more CD33M than do carriers of the rs3865444 AA reference allele. However, when equal quantities of CD33M protein are loaded onto these blots to facilitate comparison of basal and CLU-induced CD33 ITIM phosphorylation, the specific activity of CD33M signaling is the same. Representative Western blots for Supplemental Figure 5F. Treatment of Human monocytes with 0.06 µM CLU for 15 min at 37°C increases tyrosine phosphorylation of the ITIM domain on endogenous CD33M. Middle panel : Quantitative western blots of lysates for human blood monocytes reveal that monocytes from homozygous carriers of the rs3865444 AA reference express less total CD33 and less CD33M than do homozygous carriers of the rs3865444 CC risk allele. Right panel : Representative western blots showing that treatment of human monocytes with 0.06 µM CLU for 15 min at 37°C increases tyrosine phosphorylation of the ITIM domain on endogenous CD33M both in individuals homozygous for the rs3865444 CC risk allele (person 2) and in individuals homozygous for the rs3865444 AA reference /nonrisk allele (person 1). Representative western blots are available in Extended Data Figure 5C-G. NB: As demonstrated in the left panel, carriers of the rs3865444 CC risk allele express much more CD33M than do carriers of the rs3865444 AA reference allele. However, when equal quantities of CD33M protein are loaded (bottom right panel) onto these blots to facilitate comparison of basal and CLU-induced CD33 ITIM phosphorylation, the specific activity of CD33M signaling is the same.

    Article Snippet: In the first antibody incubation, rabbit anti-human CD33 (Bioss, bs-2042R, 1:400) and mouse anti-human SHP-1 (Thermo Scientific, MA5-38614, 1: 400), were performed overnight at 4°C.

    Techniques: Phospho-proteomics, Western Blot, Comparison, Activity Assay

    a. CD33 M co-immunoprecipitates sialylated CLU, but not desialylated CLU. Endogenous human CD33 expressed on human monocytic U937 cells interact with native human plasma CLU, but not with desialylated CLU applied to the culture supernatant. The graph shows quantification of western blots of anti-CD33 co-immunoprecipitation products from cell lysates, blotted with anti-CLU antibodies. Quantification is performed by measuring the band intensities on autoradiograms of co-IP Western blots using anti-CD33 and anti-CLU antibodies to detect CD33 and coprecipitating CLU respectively. The result (CD33-bound CLU) is expressed as the ratio of CLU to CD33 band intensities as arbitrary units (a.u.). Representative western blot is shown in left panel. *** = p<0.0001; Student t-test; error bars = mean ± SEM CLU: 1.23±0.04; desCLU: 0.23 ± 0.051; n = 5 independent replications. b. CD33 M but not CD33 m co-immunoprecipitates with CLU. The graph shows quantification of CLU co-precipitating with CD33 M in HEK293 cells as measured by the band intensities on western blots of the co-immunoprecipitating products. The results are expressed as CD33-bound CLU using arbitrary units to depict the ratio of CLU band intensity relative to the CD33 band intensity. HEK293 cells expressed: CD33 M only (CD33 M/M dimers), both CD33 M and CD33 m (CD33 M/M ; CD33 M / m or CD33 m/m dimers) (CLU does not co-precipitate with CD33 in cells expressing only CD33 m/m dimers). Graph columns 3 and 4 depict the results for cells expressing both CD33 M and CD33 m . The third column shows the CLU: CD33 M ratio. The fourth column shows the CD33 bound-CLU ratio computed for total cellular CD33. The HA epitope tag on both CD33 M and CD33m is used to measure both CD33 M and CD33 m immunoreactivities (CD33 Total ). A representative blot is shown in , right panel *** = p<0.00001; two-tailed Student t- tests; error bars = mean ± SEM CD33 M : 0.85 ± 0.023; CD33m: 0.004 ± 0.00043; CD33 M / m : 0.45±0.041; n = 5 biological replications. c. Dimerization of CD33 is required for CLU binding Co-IP studies on lysates from HEK293 cells expressing similar quantities of CD33 M reveal that much less CLU is co- precipitated with the CD33 M-5X dimer interface mutant than with wild type CD33 M . The data is quantified as in panel b. A representative western blot is available in . *** p<0.00001, error bars = mean ± SEM CD33 M : 0.425 ± 0.0073; CD33 M- 5X : 0.012 ± 0.006; n = 5 replications. Each lane represents one independent biological replication of the respective condition. d. CLU binds to CD33 M ECD with nanomolar avidity via sialic acids: i. BLI curves of CLU binding to CD33 M ECD WT; ii. Desialylated-CLU showed no detectable binding to CD33 M ECD WT; iii . CD33 M ECD R119A mutant showed no detectable CLU binding. CLU concentrations are indicated. Each binding curve is the average of n = 4 independent measurements; iv . R119A mutation of the canonical sialic acid binding site disrupts CLU binding. Steady-state BLI analysis of the CLU binding to CD33 M ECD WT (yellow square) or CD33 M ECD R119A (open square) and desialylated-human CLU to CD33 M ECD WT (pink square). Curve fitting was performed using Hill equation. Equilibrium dissociation constant is 27.9 ± 7.2 nM. This result is not due to misfolding of the CD33 M R119A protein because the Far UV CD spectra of wild type and R119A proteins are similar . Error bars = SD. n = 4 independent replications; v. CLU+Aβ 1-42 showed similar binding avidity to CD33 M ectodomain with CLU alone. Steady-state BLI analysis of the CLU/Aβ 1-42 mixture binding to CD33 M ECD WT (teal square). yellow squares indicate binding responses of CLU alone to CD33 M ECD WT. Curve fitting was performed using Hill equation. Equilibrium dissociation constant of CLU/Aβ42 is 28.2 ± 4.9 nM; vi. BLI curves of CLU/Aβ 1-42 mixture binding to CD33 M ECD WT. Binding curves obtained from the same concentration of Aβ 1-42 alone was subtracted from the curve from CLU/Aβ 1-42 mixture. Each curve is the average of four independent measurements. CLU/Aβ 1-42 concentrations are indicated. Error bars = SD, n = 4 independent biological replications. e. ApoE does not bind to CD33 . Representative western blots for co-immunoprecipitation of ApoE isoforms with His-tagged CD33 and ApoER2. 20µg wild-type (WT) and mutant (R119A) CD33 proteins with or without glycosylation (G) fused to His-tag were incubated with 50µl dynabeads, followed by incubation with 500µl of ApoE3 or ApoE4 (3µg/ml). ApoE bound to CD33 and ApoER2 was detected by immunoblots using anti-ApoE antibody. Beads only and ApoER2 ectodomain with His-tag were used for negative and positive controls, respectively. N = 4 replications.

    Journal: bioRxiv

    Article Title: CD33 and clusterin interact biophysically and genetically to modulate Alzheimer risk

    doi: 10.1101/2025.07.29.667318

    Figure Lengend Snippet: a. CD33 M co-immunoprecipitates sialylated CLU, but not desialylated CLU. Endogenous human CD33 expressed on human monocytic U937 cells interact with native human plasma CLU, but not with desialylated CLU applied to the culture supernatant. The graph shows quantification of western blots of anti-CD33 co-immunoprecipitation products from cell lysates, blotted with anti-CLU antibodies. Quantification is performed by measuring the band intensities on autoradiograms of co-IP Western blots using anti-CD33 and anti-CLU antibodies to detect CD33 and coprecipitating CLU respectively. The result (CD33-bound CLU) is expressed as the ratio of CLU to CD33 band intensities as arbitrary units (a.u.). Representative western blot is shown in left panel. *** = p<0.0001; Student t-test; error bars = mean ± SEM CLU: 1.23±0.04; desCLU: 0.23 ± 0.051; n = 5 independent replications. b. CD33 M but not CD33 m co-immunoprecipitates with CLU. The graph shows quantification of CLU co-precipitating with CD33 M in HEK293 cells as measured by the band intensities on western blots of the co-immunoprecipitating products. The results are expressed as CD33-bound CLU using arbitrary units to depict the ratio of CLU band intensity relative to the CD33 band intensity. HEK293 cells expressed: CD33 M only (CD33 M/M dimers), both CD33 M and CD33 m (CD33 M/M ; CD33 M / m or CD33 m/m dimers) (CLU does not co-precipitate with CD33 in cells expressing only CD33 m/m dimers). Graph columns 3 and 4 depict the results for cells expressing both CD33 M and CD33 m . The third column shows the CLU: CD33 M ratio. The fourth column shows the CD33 bound-CLU ratio computed for total cellular CD33. The HA epitope tag on both CD33 M and CD33m is used to measure both CD33 M and CD33 m immunoreactivities (CD33 Total ). A representative blot is shown in , right panel *** = p<0.00001; two-tailed Student t- tests; error bars = mean ± SEM CD33 M : 0.85 ± 0.023; CD33m: 0.004 ± 0.00043; CD33 M / m : 0.45±0.041; n = 5 biological replications. c. Dimerization of CD33 is required for CLU binding Co-IP studies on lysates from HEK293 cells expressing similar quantities of CD33 M reveal that much less CLU is co- precipitated with the CD33 M-5X dimer interface mutant than with wild type CD33 M . The data is quantified as in panel b. A representative western blot is available in . *** p<0.00001, error bars = mean ± SEM CD33 M : 0.425 ± 0.0073; CD33 M- 5X : 0.012 ± 0.006; n = 5 replications. Each lane represents one independent biological replication of the respective condition. d. CLU binds to CD33 M ECD with nanomolar avidity via sialic acids: i. BLI curves of CLU binding to CD33 M ECD WT; ii. Desialylated-CLU showed no detectable binding to CD33 M ECD WT; iii . CD33 M ECD R119A mutant showed no detectable CLU binding. CLU concentrations are indicated. Each binding curve is the average of n = 4 independent measurements; iv . R119A mutation of the canonical sialic acid binding site disrupts CLU binding. Steady-state BLI analysis of the CLU binding to CD33 M ECD WT (yellow square) or CD33 M ECD R119A (open square) and desialylated-human CLU to CD33 M ECD WT (pink square). Curve fitting was performed using Hill equation. Equilibrium dissociation constant is 27.9 ± 7.2 nM. This result is not due to misfolding of the CD33 M R119A protein because the Far UV CD spectra of wild type and R119A proteins are similar . Error bars = SD. n = 4 independent replications; v. CLU+Aβ 1-42 showed similar binding avidity to CD33 M ectodomain with CLU alone. Steady-state BLI analysis of the CLU/Aβ 1-42 mixture binding to CD33 M ECD WT (teal square). yellow squares indicate binding responses of CLU alone to CD33 M ECD WT. Curve fitting was performed using Hill equation. Equilibrium dissociation constant of CLU/Aβ42 is 28.2 ± 4.9 nM; vi. BLI curves of CLU/Aβ 1-42 mixture binding to CD33 M ECD WT. Binding curves obtained from the same concentration of Aβ 1-42 alone was subtracted from the curve from CLU/Aβ 1-42 mixture. Each curve is the average of four independent measurements. CLU/Aβ 1-42 concentrations are indicated. Error bars = SD, n = 4 independent biological replications. e. ApoE does not bind to CD33 . Representative western blots for co-immunoprecipitation of ApoE isoforms with His-tagged CD33 and ApoER2. 20µg wild-type (WT) and mutant (R119A) CD33 proteins with or without glycosylation (G) fused to His-tag were incubated with 50µl dynabeads, followed by incubation with 500µl of ApoE3 or ApoE4 (3µg/ml). ApoE bound to CD33 and ApoER2 was detected by immunoblots using anti-ApoE antibody. Beads only and ApoER2 ectodomain with His-tag were used for negative and positive controls, respectively. N = 4 replications.

    Article Snippet: In the first antibody incubation, rabbit anti-human CD33 (Bioss, bs-2042R, 1:400) and mouse anti-human SHP-1 (Thermo Scientific, MA5-38614, 1: 400), were performed overnight at 4°C.

    Techniques: Clinical Proteomics, Western Blot, Immunoprecipitation, Co-Immunoprecipitation Assay, Expressing, Two Tailed Test, Binding Assay, Mutagenesis, Circular Dichroism, Concentration Assay, Glycoproteomics, Incubation

    a. Compared to monocytes from human CD33 “AA” protective allele carriers, monocytes from CD33 “CC” risk allele carriers have reduced clearance of human amyloid plaques in ex vivo brain slices from 5XFAD transgenic human APP mice. Serial sections of unfixed brain from 5XFAD mice were incubated 48 hours with medium only, or with medium plus PBMCs from AA (protective) or CC (risk) allele carriers. Plaques were quantified by anti-Aβ immunofluorescent staining. The results were expressed as plaque number (i), brain area covered by plaques (ii) and plaque size (iii). The results were normalised to the results for medium only. N = 10 independent replications. ***p<0.001, *p<0.05; unpaired student’s t-test; error bars = mean ± SEM. Representative images are in . b. Human U937 monocytic cells clear amyloid plaques from ex vivo brain slices, and this is impaired by CLU. Clearance of Aβ plaques from three serial sections of unfixed 5XFAD brain was quantified by immunofluorescent staining of hippocampal Aβ plaques following 48h incubation with medium only, with U937 cells only, or U937 cells + CLU. Results are expressed as number of plaques (i) or area covered by Aβ (ii), and were normalised to the result for slices exposed to medium only. *p<0.05, **p< 0.01, ***p<0.001; unpaired student’s t-test; error bars = mean ± SEM n = 8 replications. Representative images are in . c. Compared to CLU, desCLU does not downregulate clearance of Aβ plaques by human U937 monocytic cells. Clearance of Abeta plaques was quantified by immunofluorescent staining of hippocampal Aβ plaques in three serial sections from 5XFAD brain following 48h incubation with medium only, with U937 cells plus medium containing desCLU, or with U937 cells plus medium containing CLU. Results are expressed as number of plaques (i) or area covered by Aβ (ii) and representative images are in . *p<0.05, **p<0.01, ***p<0.001, one-way ANOVA Tukey’s multiple comparisons test; error bars = mean ± SEM, n = 10 replications.

    Journal: bioRxiv

    Article Title: CD33 and clusterin interact biophysically and genetically to modulate Alzheimer risk

    doi: 10.1101/2025.07.29.667318

    Figure Lengend Snippet: a. Compared to monocytes from human CD33 “AA” protective allele carriers, monocytes from CD33 “CC” risk allele carriers have reduced clearance of human amyloid plaques in ex vivo brain slices from 5XFAD transgenic human APP mice. Serial sections of unfixed brain from 5XFAD mice were incubated 48 hours with medium only, or with medium plus PBMCs from AA (protective) or CC (risk) allele carriers. Plaques were quantified by anti-Aβ immunofluorescent staining. The results were expressed as plaque number (i), brain area covered by plaques (ii) and plaque size (iii). The results were normalised to the results for medium only. N = 10 independent replications. ***p<0.001, *p<0.05; unpaired student’s t-test; error bars = mean ± SEM. Representative images are in . b. Human U937 monocytic cells clear amyloid plaques from ex vivo brain slices, and this is impaired by CLU. Clearance of Aβ plaques from three serial sections of unfixed 5XFAD brain was quantified by immunofluorescent staining of hippocampal Aβ plaques following 48h incubation with medium only, with U937 cells only, or U937 cells + CLU. Results are expressed as number of plaques (i) or area covered by Aβ (ii), and were normalised to the result for slices exposed to medium only. *p<0.05, **p< 0.01, ***p<0.001; unpaired student’s t-test; error bars = mean ± SEM n = 8 replications. Representative images are in . c. Compared to CLU, desCLU does not downregulate clearance of Aβ plaques by human U937 monocytic cells. Clearance of Abeta plaques was quantified by immunofluorescent staining of hippocampal Aβ plaques in three serial sections from 5XFAD brain following 48h incubation with medium only, with U937 cells plus medium containing desCLU, or with U937 cells plus medium containing CLU. Results are expressed as number of plaques (i) or area covered by Aβ (ii) and representative images are in . *p<0.05, **p<0.01, ***p<0.001, one-way ANOVA Tukey’s multiple comparisons test; error bars = mean ± SEM, n = 10 replications.

    Article Snippet: In the first antibody incubation, rabbit anti-human CD33 (Bioss, bs-2042R, 1:400) and mouse anti-human SHP-1 (Thermo Scientific, MA5-38614, 1: 400), were performed overnight at 4°C.

    Techniques: Ex Vivo, Transgenic Assay, Incubation, Staining

    Human monocytes from CD33 “CC” risk allele carriers have reduced clearance of human amyloid plaques in ex vivo brain slices compared to monocytes from CD33 “AA” protective allele carriers. Representative figures quantified in of clearance of hippocampal Aβ plaques by human monocytes following incubation on serial sections of unfixed brain from 5XFAD mice. Immunofluorescent staining of hippocampal Aβ plaques (green) following 48h incubation with medium only with no cells ( left ) or with CC (risk allele) genotype monocytes ( middle ) or with AA (protective allele) monocytes ( right ). N = 10 independent replications). DAPI blue = nuclei.

    Journal: bioRxiv

    Article Title: CD33 and clusterin interact biophysically and genetically to modulate Alzheimer risk

    doi: 10.1101/2025.07.29.667318

    Figure Lengend Snippet: Human monocytes from CD33 “CC” risk allele carriers have reduced clearance of human amyloid plaques in ex vivo brain slices compared to monocytes from CD33 “AA” protective allele carriers. Representative figures quantified in of clearance of hippocampal Aβ plaques by human monocytes following incubation on serial sections of unfixed brain from 5XFAD mice. Immunofluorescent staining of hippocampal Aβ plaques (green) following 48h incubation with medium only with no cells ( left ) or with CC (risk allele) genotype monocytes ( middle ) or with AA (protective allele) monocytes ( right ). N = 10 independent replications). DAPI blue = nuclei.

    Article Snippet: In the first antibody incubation, rabbit anti-human CD33 (Bioss, bs-2042R, 1:400) and mouse anti-human SHP-1 (Thermo Scientific, MA5-38614, 1: 400), were performed overnight at 4°C.

    Techniques: Ex Vivo, Incubation, Staining

    Compared to CLU, desCLU does not downregulate clearance of Aβ plaques by human U937 monocytic cells. Representative figures quantified in of clearance of hippocampal Aβ plaques (green) by U937 cells following incubation on serial sections of unfixed brain from 5XFAD mice in the presence of CLU or desCLU. Immunofluorescent staining of hippocampal Aβ plaques following 48h incubation with medium only but no cells ( left ) or with U937 cells + desCLU ( middle ) or with U937 cells + CLU ( right ). Small figure magnifications of regions of interest: A: x10; B: x20. Scale bars: 100 μm in I and A; and 50 μm in B. n = 10 replications

    Journal: bioRxiv

    Article Title: CD33 and clusterin interact biophysically and genetically to modulate Alzheimer risk

    doi: 10.1101/2025.07.29.667318

    Figure Lengend Snippet: Compared to CLU, desCLU does not downregulate clearance of Aβ plaques by human U937 monocytic cells. Representative figures quantified in of clearance of hippocampal Aβ plaques (green) by U937 cells following incubation on serial sections of unfixed brain from 5XFAD mice in the presence of CLU or desCLU. Immunofluorescent staining of hippocampal Aβ plaques following 48h incubation with medium only but no cells ( left ) or with U937 cells + desCLU ( middle ) or with U937 cells + CLU ( right ). Small figure magnifications of regions of interest: A: x10; B: x20. Scale bars: 100 μm in I and A; and 50 μm in B. n = 10 replications

    Article Snippet: In the first antibody incubation, rabbit anti-human CD33 (Bioss, bs-2042R, 1:400) and mouse anti-human SHP-1 (Thermo Scientific, MA5-38614, 1: 400), were performed overnight at 4°C.

    Techniques: Incubation, Staining