|
MedChemExpress
ppm plx5622 Ppm Plx5622, supplied by MedChemExpress, used in various techniques. Bioz Stars score: 95/100, based on 1 PubMed citations. ZERO BIAS - scores, article reviews, protocol conditions and more https://www.bioz.com/result/ppm plx5622/product/MedChemExpress Average 95 stars, based on 1 article reviews
ppm plx5622 - by Bioz Stars,
2026-04
95/100 stars
|
Buy from Supplier |
|
TargetMol
bioavailable csf1r inhibitor plx5622 Bioavailable Csf1r Inhibitor Plx5622, supplied by TargetMol, used in various techniques. Bioz Stars score: 94/100, based on 1 PubMed citations. ZERO BIAS - scores, article reviews, protocol conditions and more https://www.bioz.com/result/bioavailable csf1r inhibitor plx5622/product/TargetMol Average 94 stars, based on 1 article reviews
bioavailable csf1r inhibitor plx5622 - by Bioz Stars,
2026-04
94/100 stars
|
Buy from Supplier |
|
MedChemExpress
plx5622 Plx5622, supplied by MedChemExpress, used in various techniques. Bioz Stars score: 96/100, based on 1 PubMed citations. ZERO BIAS - scores, article reviews, protocol conditions and more https://www.bioz.com/result/plx5622/product/MedChemExpress Average 96 stars, based on 1 article reviews
plx5622 - by Bioz Stars,
2026-04
96/100 stars
|
Buy from Supplier |
|
Selleck Chemicals
microglia Microglia, supplied by Selleck Chemicals, used in various techniques. Bioz Stars score: 93/100, based on 1 PubMed citations. ZERO BIAS - scores, article reviews, protocol conditions and more https://www.bioz.com/result/microglia/product/Selleck Chemicals Average 93 stars, based on 1 article reviews
microglia - by Bioz Stars,
2026-04
93/100 stars
|
Buy from Supplier |
|
MedChemExpress
ain 76a chow Ain 76a Chow, supplied by MedChemExpress, used in various techniques. Bioz Stars score: 94/100, based on 1 PubMed citations. ZERO BIAS - scores, article reviews, protocol conditions and more https://www.bioz.com/result/ain 76a chow/product/MedChemExpress Average 94 stars, based on 1 article reviews
ain 76a chow - by Bioz Stars,
2026-04
94/100 stars
|
Buy from Supplier |
|
Plexxikon
plx5622 Plx5622, supplied by Plexxikon, used in various techniques. Bioz Stars score: 90/100, based on 1 PubMed citations. ZERO BIAS - scores, article reviews, protocol conditions and more https://www.bioz.com/result/plx5622/product/Plexxikon Average 90 stars, based on 1 article reviews
plx5622 - by Bioz Stars,
2026-04
90/100 stars
|
Buy from Supplier |
|
Sutro Biopharma
csf1r antagonist plx5622 Csf1r Antagonist Plx5622, supplied by Sutro Biopharma, used in various techniques. Bioz Stars score: 90/100, based on 1 PubMed citations. ZERO BIAS - scores, article reviews, protocol conditions and more https://www.bioz.com/result/csf1r antagonist plx5622/product/Sutro Biopharma Average 90 stars, based on 1 article reviews
csf1r antagonist plx5622 - by Bioz Stars,
2026-04
90/100 stars
|
Buy from Supplier |
|
Cayman Chemical
plx5622 compound Plx5622 Compound, supplied by Cayman Chemical, used in various techniques. Bioz Stars score: 90/100, based on 1 PubMed citations. ZERO BIAS - scores, article reviews, protocol conditions and more https://www.bioz.com/result/plx5622 compound/product/Cayman Chemical Average 90 stars, based on 1 article reviews
plx5622 compound - by Bioz Stars,
2026-04
90/100 stars
|
Buy from Supplier |
|
Nissen
plx5622  Plx5622, supplied by Nissen, used in various techniques. Bioz Stars score: 90/100, based on 1 PubMed citations. ZERO BIAS - scores, article reviews, protocol conditions and more https://www.bioz.com/result/plx5622/product/Nissen Average 90 stars, based on 1 article reviews
plx5622 - by Bioz Stars,
2026-04
90/100 stars
|
Buy from Supplier |
|
research diets inc
plx5622 diet 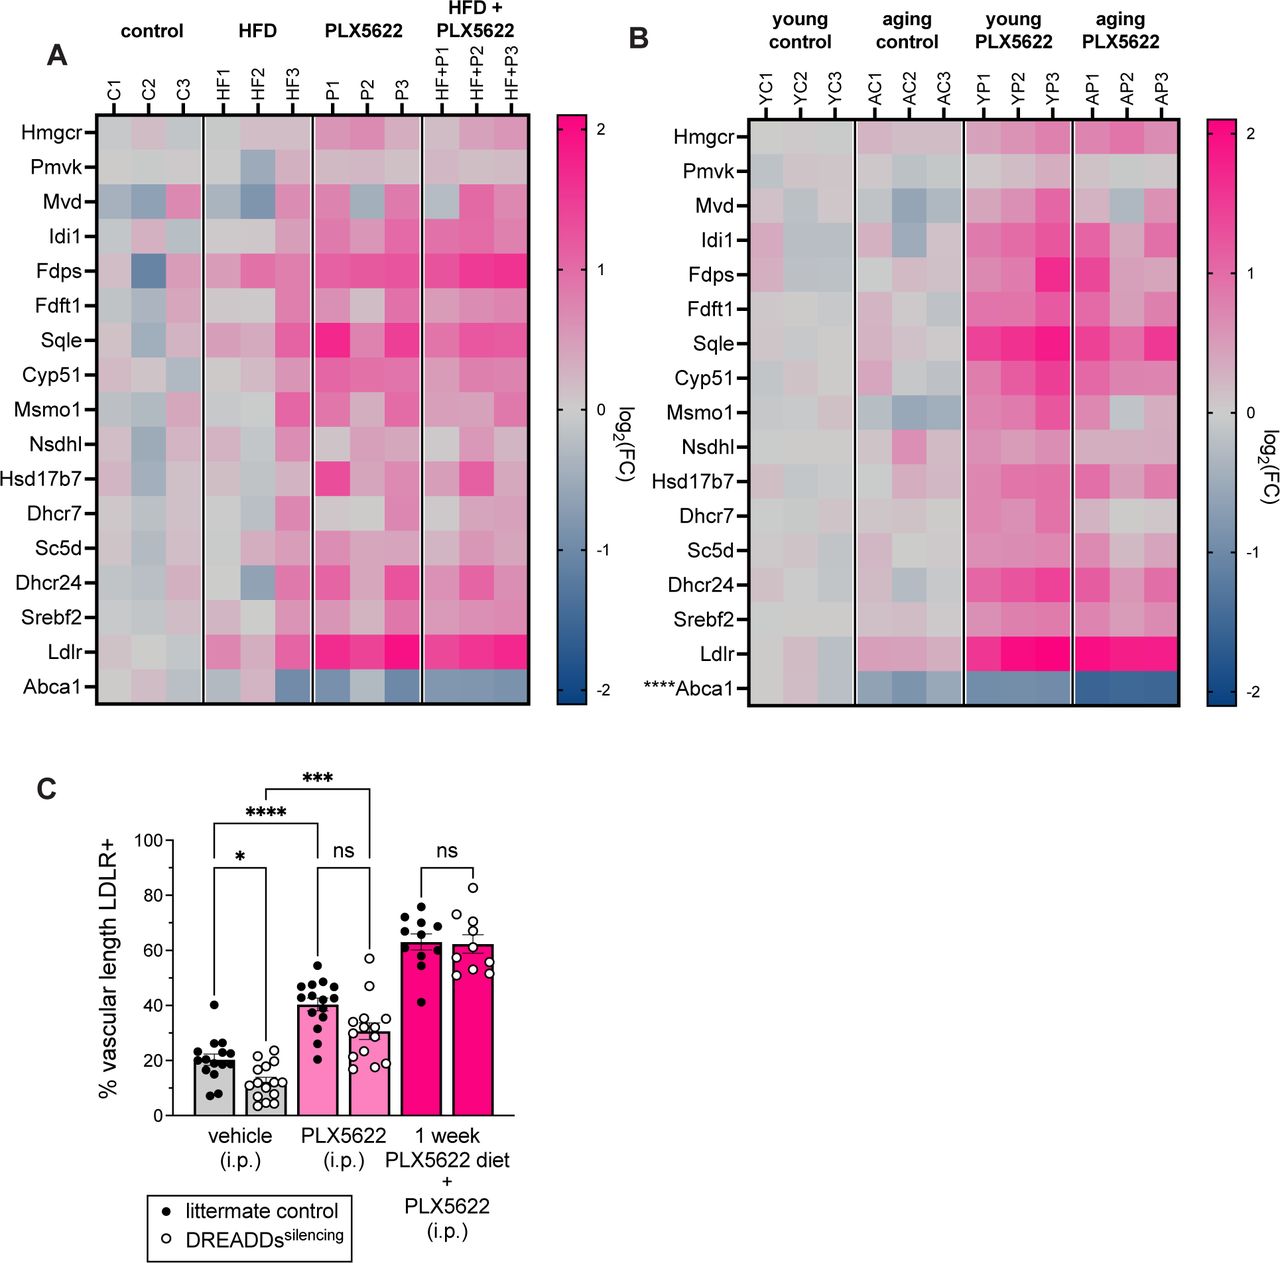 Plx5622 Diet, supplied by research diets inc, used in various techniques. Bioz Stars score: 90/100, based on 1 PubMed citations. ZERO BIAS - scores, article reviews, protocol conditions and more https://www.bioz.com/result/plx5622 diet/product/research diets inc Average 90 stars, based on 1 article reviews
plx5622 diet - by Bioz Stars,
2026-04
90/100 stars
|
Buy from Supplier |
|
Dyets Inc
plx5622  Plx5622, supplied by Dyets Inc, used in various techniques. Bioz Stars score: 90/100, based on 1 PubMed citations. ZERO BIAS - scores, article reviews, protocol conditions and more https://www.bioz.com/result/plx5622/product/Dyets Inc Average 90 stars, based on 1 article reviews
plx5622 - by Bioz Stars,
2026-04
90/100 stars
|
Buy from Supplier |
|
MedKoo Inc
plx5622 (plx Plx5622 (Plx, supplied by MedKoo Inc, used in various techniques. Bioz Stars score: 90/100, based on 1 PubMed citations. ZERO BIAS - scores, article reviews, protocol conditions and more https://www.bioz.com/result/plx5622 (plx/product/MedKoo Inc Average 90 stars, based on 1 article reviews
plx5622 (plx - by Bioz Stars,
2026-04
90/100 stars
|
Buy from Supplier |
Image Search Results
Journal: Glia
Article Title: Long‐term reprogramming of primed microglia after moderate inhibition of CSF1R signaling
doi: 10.1002/glia.24627
Figure Lengend Snippet: Long‐term impact on microglia of a transient low‐dose PLX5622 treatment applied after acute neuroinflammation in mice. (a) Scheme of the experimental design, where mice were intracerebroventricular (ICV) injected with neuraminidase (control mice were injected with saline) to induce neuroinflammation and microglial priming. Three weeks later, mice received a daily IP dose (60 mg/kg) of PLX5622 (control mice were injected with vehicle DMSO). Seven weeks after treatment completion (12 weeks from the initial ICV injection), all mice received an intraperitoneal (IP) dose of lipopolysaccharide (LPS) to induce peripheral inflammation, and were euthanized 12 h later. (b–i) IBA1 immunostaining of representative brain sections of mice from the above experiment. Microglia were studied in the dentate gyrus of the hippocampus (b–e) and in the paraventricular nucleus of the hypothalamus (f–i). In each image, a representative cell (squared) is shown enlarged below (b' through i', respectively), along with its profiles (filled, outlined, and skeleton shapes) obtained for the subsequent morphological analysis. Scale bars in b‐i are 100 μm. Scale bars in b'–i' sampled cells are 20 μm. DMSO, dimethyl sulfoxide; LPS, lipopolysaccharide; NA, neuraminidase; PLX, PLX5622; Sal, saline.
Article Snippet: The mild treatment of
Techniques: Injection, Control, Saline, Immunostaining

Journal: Glia
Article Title: Long‐term reprogramming of primed microglia after moderate inhibition of CSF1R signaling
doi: 10.1002/glia.24627
Figure Lengend Snippet: Microglia and astrocyte cell counts in the hippocampus and the hypothalamus after PLX5622 treatment and peripheral lipopolysaccharide (LPS) stimulation. (a–d) Cell counts were carried out in brain sections immunostained with IBA1 (a, c) for microglial counts, or GFAP (b, d) for astrocytes quantifications. Counts were performed in the dentate gyrus of the hippocampus (a, b) and the paraventricular nucleus (PVN) of the hypothalamus (c, d). Histograms show the mean ± SD of n = 5–7 mice per group. * p < .05; *** p < .001; **** p < .0001.
Article Snippet: The mild treatment of
Techniques:

Journal: Glia
Article Title: Long‐term reprogramming of primed microglia after moderate inhibition of CSF1R signaling
doi: 10.1002/glia.24627
Figure Lengend Snippet: Morphological analysis of IBA1 immunostained microglial cells sampled from the hippocampal dentate gyrus (DG) and the paraventricular nucleus (PVN) of the hypothalamus. Morphological analysis was carried out by three different methods: (a–d, h–k) Fractal analysis, (e, l) Sholl analysis and (f,g, m,n) Skeleton analysis. Representative parameters are shown here; additional parameters are available as Supporting information. Data distribution of each parameter is presented as violin plot, which has been truncated at the maximum and minimum values of each dataset; the dashed line represents the median and the dotted line the quartiles. A total of n = 250–260 cells from DG and n = 240–250 cells from PVN, sampled from different animals within each experimental group, were analyzed. DMSO, dimethyl sulfoxide; neuraminidase; PLX, PLX5622; Sal, saline; NA. * p < .05; ** p < .01; *** p < .001; **** p < .0001.
Article Snippet: The mild treatment of
Techniques: Saline

Journal: Glia
Article Title: Long‐term reprogramming of primed microglia after moderate inhibition of CSF1R signaling
doi: 10.1002/glia.24627
Figure Lengend Snippet: Principal components analysis (PCA) carried out with morphological parameters of microglial cells sampled from the dentate gyrus (DG) and the paraventricular nucleus (PVN) of the hypothalamus. (a, f) A total of 27 parameters were used for PCA, which were obtained from Fractal (shaded in yellow), Skeleton (shaded in pink), and Sholl (shaded in gray) morphological analysis. For the data obtained from DG microglia KMO = 0.849, χ 2 = 16349.691, and p < .0001. For the data from PVN microglia KMO = 0.832, χ 2 = 15200.137, and p < .0001. Tables present the PC scores for each parameter and the principal components (Eigenvalue >1) disclosed from the analysis, which have been named according to the highest parameters' scores for each component: PC1, PC2 and PC3. (b–d, g–i) Representation with histograms of the PC scores for PC1, PC2 and PC3 obtained from microglia sampled from dentate gyrus (b–d) and paraventricular nucleus (g–i). The bars represent the mean ± SD of n = 45–65 cells per experimental group. In order to reveal any significant difference between groups, a one‐way ANOVA and Tuckey post‐hoc test were conducted. (e, j) Distribution on the principal components plane of PC1 scores versus PC3 scores of n = 231 (sampled from DG) and n = 223 (sampled from PVN) individual microglial cells from the different experimental groups. The highlighted dots are the mean PC1–PC3 for each group. The filled profile of a representative cell from each group is depicted. DMSO, dimethyl sulfoxide; NA, neuraminidase; PLX, PLX5622; Sal, saline. * p < .05; ** p < .01; *** p < .001.
Article Snippet: The mild treatment of
Techniques: Saline

Journal: Glia
Article Title: Long‐term reprogramming of primed microglia after moderate inhibition of CSF1R signaling
doi: 10.1002/glia.24627
Figure Lengend Snippet: Gene expression in the hippocampus and the periventricular hypothalamus after PLX5622 treatment and peripheral lipopolysaccharide (LPS) stimulation. Mice were NA/saline‐injected and, 3 weeks later, treated with PLX5622 or vehicle DMSO. Seven weeks after treatment termination, LPS was injected intraperitoneal (IP) and mice euthanized 12 h later for tissue sampling. The mRNA levels of inflammation‐related genes and of the receptor target of PLX5622 (CSF1R) were quantified by quantitative polymerase chain reaction (qPCR), and expressed relative to the expression of the housekeeping gene GAPDH. (a–h) Quantification performed in hippocampus tissue. (i–p) Quantification performed in periventricular hypothalamic tissue. The histograms show the mean ± SD of n = 5–6 animals. DMSO, dimethyl sulfoxide; NA, neuraminidase; PLX, PLX5622; Sal, saline. * p < .05; ** p < .01; *** p < .001; **** p < .0001.
Article Snippet: The mild treatment of
Techniques: Gene Expression, Saline, Injection, Sampling, Real-time Polymerase Chain Reaction, Expressing

Journal: Glia
Article Title: Long‐term reprogramming of primed microglia after moderate inhibition of CSF1R signaling
doi: 10.1002/glia.24627
Figure Lengend Snippet: Quantification of cytokines in protein extracts from the hippocampus and the periventricular hypothalamus after PLX5622 treatment and peripheral lipopolysaccharide (LPS) stimulation. Mice were NA/saline‐injected and, 3 weeks later, treated with PLX5622 or vehicle DMSO. Seven weeks after treatment termination, LPS was injected intraperitoneal (IP) and mice euthanized 12 h later for tissue sampling. Cytokines were quantified from protein extracts by multiplex ELISA, and their amount expressed relative to the protein content of the extract. (a–d) Quantification performed in hippocampus tissue. (e–h) Quantification performed in periventricular hypothalamic tissue. The histograms show the mean ± SD of n = 5–7 mice. DMSO, dimethyl sulfoxide; NA, neuraminidase; PLX, PLX5622; Sal, saline. * p < .05.
Article Snippet: The mild treatment of
Techniques: Saline, Injection, Sampling, Multiplex Assay, Enzyme-linked Immunosorbent Assay
Journal: bioRxiv
Article Title: Activity-dependent regulation of vascular cholesterol metabolism acts as a negative feedback mechanism for neurovascular coupling
doi: 10.1101/2024.02.23.581685
Figure Lengend Snippet: (A) Heat map of cholesterol gene expression in brain endothelial cells after one month of control (C), high-fat (HF), PLX5622 (P), or high-fat+PLX5622 (HF+P) diet. Endothelial cells were isolated by FACS, and bulk RNA sequencing was performed on isolated mRNA. Each column is one sample. No cholesterol-related genes had a p-adj<0.05 in the comparison between control vs high-fat diet groups. Heat map color scale indicates log 2 fold change from the average gene expression in mice on control diet. (B) Heat map of cholesterol gene expression in brain endothelial cells at age 12 weeks (young, Y) or 17.5 months (aging, A). Mice were raised on vivarium chow and switched to control (C) or PLX5622 (P) diet starting at 8 weeks of age to the time of tissue collection. Endothelial cells were isolated by FACS, and bulk RNA sequencing was performed on isolated mRNA. Each column is one sample. Asterisks indicate adjusted p-value (*p-adj<0.05; **p-adj<0.01; ***p-adj<0.001; ****p-adj<0.0001) for young vs aging mice on control diet. Heat map color scale indicates log 2 fold change from the average gene expression in young mice on control diet. (C) Quantification of percentage of CD31+ vascular length that is also LDLR+ in DREADDs silencing and control mice injected with PLX5622 or vehicle at the onset of the dark (waking) cycle (time=0). All mice were injected with CNO at times 0, 4, and 8 hours to maintain neuronal silencing, and tissue was collected at t=12 hours. Silencing reduced percent vascular length that was LDLR+ while PLX5622 increased it (p=0.0229; p=0.0002). There was a trend towards lower percent vascular length LDLR+ in the PLX5622+silencing group compared to the PLX5622 group (p=0.0827). Experiment was repeated in a second cohort of DREADDs silencing and control mice fed PLX5622 diet for one week. After one week of PLX5622 diet, there was no difference between control and silencing groups (p>0.999). n=10-15 per group; Brown-Forsythe and Welch ANOVA. Error bars represent SEM.
Article Snippet: For ex vivo CaPA experiments, male and female adult C57BL/6 mice ordered from The Jackson Laboratory were put on control or
Techniques: Gene Expression, Control, Isolation, RNA Sequencing, Comparison, Injection

Journal: bioRxiv
Article Title: Activity-dependent regulation of vascular cholesterol metabolism acts as a negative feedback mechanism for neurovascular coupling
doi: 10.1101/2024.02.23.581685
Figure Lengend Snippet: (A) Lipidomics analysis of serum, forebrain, and liver from adult male and female mice fed control or PLX5622 diet for one month. There were no significant differences between diet groups for any detected sterol. n=3 per group; Mann-Whitney test. Error bars represent SEM. (B) Representative images from 2-photon visualization of LDL uptake approximately 90 min after BODIPY FL LDL injection. Tie2 -Cre; Ai14 f/f mice were injected i.p. with PLX5622 (50mg/kg) or vehicle 24 hours before imaging. Five minutes prior to imaging, mice were injected retro-orbitally with BODIPY TM FL LDL (50 μL, 1mg/mL). PLX5622 treatment increases the amount of BODIPY TM FL LDL (green) uptake in endothelial cells (red). (C) Quantification of BODIPY TM FL LDL fluorescence intensity in endothelial cells 60 minutes after BODIPY TM FL LDL injection. A binary mask was created after applying an intensity threshold in the red channel (endothelium). The mask was applied to the BODIPY™ FL LDL channel to measure intensity within the endothelium. Each data point represents one image stack. Stacks were obtained across three mice per condition. PLX5622 increases LDL uptake in endothelial cells. n=14-15 stacks; p<0.0001, unpaired t-test. Error bars represent SEM. (D) Quantification of BODIPY TM FL LDL brain parenchyma fluorescence intensity within carefully placed, hand-drawn ROIs in image stacks from 60-90 minutes after BODIPY TM FL LDL injection. Each data point represents one ROI. ROIs were obtained across three mice per condition. PLX5622 increases BODIPY signal in the parenchyma. n=50 ROIs; p<0.0001, Mann-Whitney test. Error bars represent SEM. (E) Quantification of capillary diameter in Tie2 -Cre; Ai14 f/f mice injected with PLX5622 (50mg/kg) or vehicle 24 hours before imaging. There was no significant difference in baseline capillary diameter. n=15-18, p=0.1457, unpaired t-test. Error bars represent SEM. (F) Representative images of vasculature after perfusion with Laurdan dye. Color scale represents general polarization. Slco1c1 -CreER T ; Fdft1 f/f and Fdft1 f/f littermate controls were fed control or PLX5622 diet for one month. Laurdan dye was perfused through vasculature and its intercalation into the vascular membrane was assessed with 2-photon imaging. (G) General polarization shift of all groups described in (F). (H) General polarization shift in Fdft1 f/f mice on control and PLX5622 diet (I) General polarization shift in Slco1c1 -CreER T ; Fdft1 f/f mice on control and PLX5622 diet (J) Quantification of BBB permeability to sodium fluorescein and Evans blue in Slco1c1 -CreER T ; Fdft1 f/f and Fdft1 f/f littermates after one month of control or PLX5622 diet. Tracers were injected i.v. and allowed to circulate 4 hours before perfusion. Tracers were extracted and concentration was calculated using a standard curve from tracer-spiked brain samples. BBB permeability was not altered by FDFT1 ECKO, PLX5622 diet, or the combination. n=3 per group. Error bars represent SEM.
Article Snippet: For ex vivo CaPA experiments, male and female adult C57BL/6 mice ordered from The Jackson Laboratory were put on control or
Techniques: Control, MANN-WHITNEY, Injection, Imaging, Fluorescence, Membrane, Permeability, Concentration Assay

Journal: bioRxiv
Article Title: Activity-dependent regulation of vascular cholesterol metabolism acts as a negative feedback mechanism for neurovascular coupling
doi: 10.1101/2024.02.23.581685
Figure Lengend Snippet: Mice were euthanized with sodium pentobarbital and decapitated. Vascular segments containing both capillaries and arterioles were dissected from cortical tissue surrounding the middle cerebral artery. The arteriole was cannulated on one end and tied off on the other to maintain pressurization. (A) Representative images of pipette placement for K + stimulation of capillaries (left, orange) and arterioles (right, purple) (B) Representative traces of arteriole dilation after K + stimulation of capillaries and arterioles from mice fed control (left) or PLX5622 diet (right) for at least 1 month before ex vivo preparation. PLX5622-mediated deficits in arteriole dilation following capillary stimulation were rescued by cholesterol depletion with 30-minute bath application of 5mM MβCD. Bath application of 0 Ca 2+ demonstrates maximum dilation capacity of arterioles. Scale bars represent 10 microns dilation and 5 minutes time. (C) Quantification of experiment shown in (B). Arteriole dilation in response to K + stimulation is represented as percentage of maximum dilation. PLX5622 induced deficits in dilation response (p-adj<0.0001) were rescued by MβCD (p-adj<0.0001). Rescued response was still significantly lower than control response (p-adj=0.0099). n=5-10, one-way ANOVA with Bonferroni’s multiple comparisons test. Error bars represent SEM. (D) Representative images of cortical sections from mice injected with AAV-BR1-smFP_Myc or AAV-BR1-LDLR. Sections stained with antibodies against CD31 (green) and LDLR (magenta). Scale bar represents 100 μm. (E) Quantification of percentage CD31+ vascular length that is also LDLR+. AAV-BR1-LDLR significantly increases vascular LDLR. n=3; p=0.0033, unpaired t-test. (F) Representative traces of arteriole dilation after K + stimulation of capillaries and arterioles from mice injected with AAV-BR1-smFP_Myc (left) or AAV-BR1-LDLR (right) 2-4 weeks before ex vivo preparation. Brain endothelial cell LDLR overexpression-mediated deficits in arteriole dilation following capillary stimulation were rescued by cholesterol depletion with 30-minute bath application of 5mM MβCD. Bath application of 0 Ca 2+ demonstrates maximum dilation capacity of arterioles. Scale bars represent 10 microns dilation and 5 minutes time. (G) Quantification of experiment shown in (D). Arteriole dilation in response to K + stimulation is represented as percentage of maximum dilation. LDLR overexpression in brain endothelial cells induced deficits in dilation response (p-adj=0.0097) were rescued by MβCD (p-adj=0.0088). Rescued response was not significantly different than control response (p-adj>0.9999). n=5-10, one-way ANOVA with Bonferroni’s multiple comparisons test. Error bars represent SEM.
Article Snippet: For ex vivo CaPA experiments, male and female adult C57BL/6 mice ordered from The Jackson Laboratory were put on control or
Techniques: Transferring, Control, Ex Vivo, Injection, Staining, Over Expression
Journal: Communications Biology
Article Title: Human α-synuclein aggregation activates ferroptosis leading to parvalbumin interneuron degeneration and motor learning impairment
doi: 10.1038/s42003-024-06896-x
Figure Lengend Snippet: a Immunofluorescent staining of microglial cells (Iba1+) and its phagocytosis toward SNCA-expressing cells (mCherry labeled) in M1 from SNCA model mice. Scale bare, 50 μm or 25 μm (enlarged views only). b The number of microglial cells in the given field was increased by SNCA overexpression. Two-sample unpaired t -test, t (7) = 3.419, P = 0.0112. N = 5 and 4 mice from mCherry and SNCA group, respectively. c Representative blotting bands of Iba1 and CD68 from M1 extracts. d Quantification of relative protein expression of Iba1 and CD68. Multiple t -test showed significant difference between groups. P = 0.038 for Iba1 and P = 0.030 for CD68. N = 4 mice in each group. e Contours of sampled microglial morphology. Scale bar, 15 μm. f Microglial cells of model mice also had larger soma size compared to control group. D = 0.9420, P < 0.0001. g SNCA model mice presented more cell processes of microglia on average. Non-parametric Kolmogorov–Smirnov test, D = 0.7429, P < 0.0001, n = 30 and 35 cells from 4 mice in each group, in ( f , g ). h Graphic illustration of microglial ablation assays. SNCA-overexpressed mice were fed with PLX5622-containing food chows for 2 weeks, in contrast with a control group receiving normal (ANI76) diet. Behavioral phenotyping was performed later. i Representative immunofluorescent staining images of microglial cells and PV-INs. Although PLX5622 did not change the level of α-synuclein, PV-IN population was maintained. Scale bar, 150 μm in upper panels and 50 μm in lower panels. j Oral PLX5622 administration remarkably decreased microglial cell density. Two-sample unpaired t -test, t (13) = 12.61, P < 0.001. k Ablation of microglial cells increased PV-INs density. t (13) = 9.071, P < 0.001. N = 7 and 8 mice in ANI76 and PLX5622 group, respectively, in ( j , k ). l PLX5622 treatment recovered mouse performance on the accelerating rotarod. Two-way ANOVA with respect to group factor, F (1117) = 34.80, P < 0.0001. Sidak’s multiple comparison test of post hoc comparison at each time point. m Microglia ablation improved the performance on vertical pole climbing task. Two-way ANOVA with respect to group factor, F (139) = 21.88, P < 0.0001. Sidak’s multiple comparison test of post hoc comparison at each time point. n PLX5622 intervention rescued impairment on the walking beam. F (1,39) = 45.28, P < 0.0001. Sidak’s multiple comparison test of post hoc comparison at each time point. N = 7 and 8 mice from ANI76 and PLX5622 group, respectively, in ( l – n ). * P < 0.05, ** P < 0.01, *** P < 0.001. All data were presented as mean ± SEM.
Article Snippet: For PLX5622 treatment, 0.12%
Techniques: Staining, Expressing, Labeling, Over Expression, Control, Comparison