mouse syn 1 Search Results


93
Miltenyi Biotec anti mouse cd138 pevio770
Anti Mouse Cd138 Pevio770, supplied by Miltenyi Biotec, used in various techniques. Bioz Stars score: 93/100, based on 1 PubMed citations. ZERO BIAS - scores, article reviews, protocol conditions and more
https://www.bioz.com/result/anti mouse cd138 pevio770/product/Miltenyi Biotec
Average 93 stars, based on 1 article reviews
anti mouse cd138 pevio770 - by Bioz Stars, 2026-04
93/100 stars
  Buy from Supplier

93
Miltenyi Biotec cd138 apc rea104
Cd138 Apc Rea104, supplied by Miltenyi Biotec, used in various techniques. Bioz Stars score: 93/100, based on 1 PubMed citations. ZERO BIAS - scores, article reviews, protocol conditions and more
https://www.bioz.com/result/cd138 apc rea104/product/Miltenyi Biotec
Average 93 stars, based on 1 article reviews
cd138 apc rea104 - by Bioz Stars, 2026-04
93/100 stars
  Buy from Supplier

93
Miltenyi Biotec cd138 pe
Cd138 Pe, supplied by Miltenyi Biotec, used in various techniques. Bioz Stars score: 93/100, based on 1 PubMed citations. ZERO BIAS - scores, article reviews, protocol conditions and more
https://www.bioz.com/result/cd138 pe/product/Miltenyi Biotec
Average 93 stars, based on 1 article reviews
cd138 pe - by Bioz Stars, 2026-04
93/100 stars
  Buy from Supplier

93
Miltenyi Biotec cd138 pe vio615
a. Spleen weight of wild-type (WT) and Ftx KO females at 3-months, 1-year and 2-years of age. Median values are shown. ( t-test , * p -values < 0.05). Underneath, representative images of WT and Ftx KO spleens from 3-month, 1-year and 2-year-old females. b. Representative images of hematoxylin-eosin staining on sections of spleens from 1-year-old WT and Ftx KO females. Scale bar; 100 μm. c. Representative flow cytometry analysis of splenic myeloid dendritic cells (m-DC) in WT and Ftx KO 1-year-old females. On the right, percentages of splenic m-DC (CD11b + CD11c + ) and splenic plasmacytoid dendritic cells (p-DC) (CD11c + B220 + SiglecH + ) in leucocytes. Each triangle represents a mouse. Median values are shown. ( t-test , * p -values < 0.05). d. Representative flow cytometry analysis of spontaneously activated B cells (B220 + CD69 + ) (upper panels) or of spontaneously activated T cells (CD4 + CD69 + ) (lower panels) in spleen from 1-year-old WT and Ftx KO females. Percentages in leucocytes are shown on the graphs beneath. Each triangle represents a mouse. Median values are shown. ( t-test , * p -values < 0.05). e. IgG2a natural antibody levels in sera of 1-year- and 2-year-old WT or Ftx KO females measured by ELISA. Each triangle represents a mouse. Median values are shown. ( t-test , * p -values < 0.05). f. Representative flow cytometry analysis of (B220 + <t>CD138</t> + ) plasma cells in the spleen of 1-year-old WT and Ftx KO females. Percentages in leucocytes are shown on the graphs beneath. Each triangle represents a mouse. Median values are shown. ( t-test , * p -values < 0.05). g. Representative flow cytometry analysis of (CD19 + B220 lo CD5 + ) natural antibody producing B1a in the peritoneal cavity (PerC) of 1-year-old WT and Ftx KO females. Percentages in leucocytes are shown on the graphs beneath. Each triangle represents a mouse. Median values are shown. ( t-test , * p -values < 0.05). h. Cytokines levels in the blood analysed with CBA assays on sera from 3-month-, 1-year-, or 2-year-old WT and Ftx KO females. Each triangle represents a mouse. Median values are shown. ( t-test , * p -values < 0.05). i. Representative flow cytometry analysis of monocyte populations including non-classical (CD11b hi CD43 lo Ly6C + ) scavenger monocytes in the spleen of 1-year-old WT and Ftx KO females. Percentages in leucocytes are shown on the graphs beneath. Each triangle represents a mouse. Median values are shown. ( t-test , * p -values < 0.05).
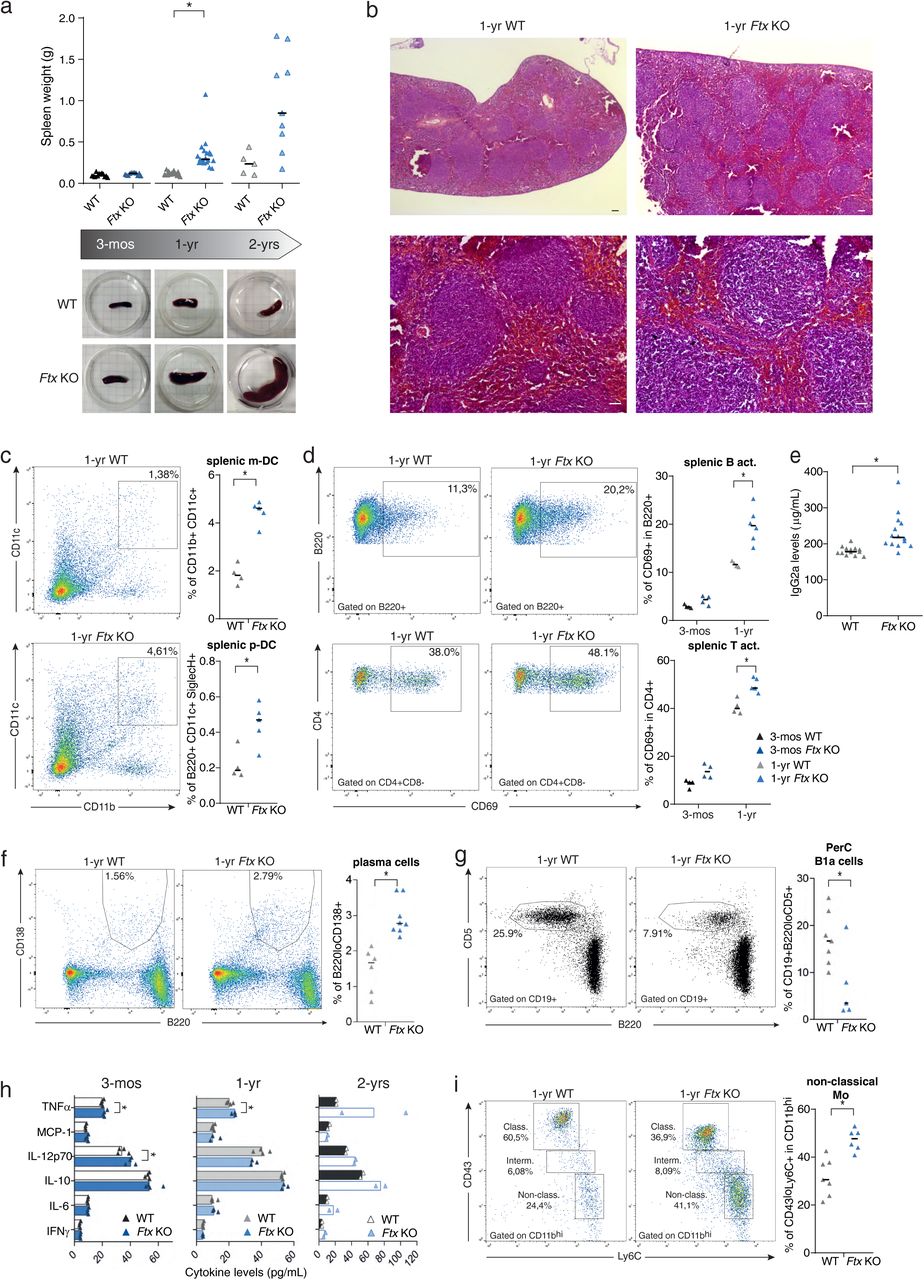
Cd138 Pe Vio615, supplied by Miltenyi Biotec, used in various techniques. Bioz Stars score: 93/100, based on 1 PubMed citations. ZERO BIAS - scores, article reviews, protocol conditions and more
https://www.bioz.com/result/cd138 pe vio615/product/Miltenyi Biotec
Average 93 stars, based on 1 article reviews
cd138 pe vio615 - by Bioz Stars, 2026-04
93/100 stars
  Buy from Supplier

Image Search Results


a. Spleen weight of wild-type (WT) and Ftx KO females at 3-months, 1-year and 2-years of age. Median values are shown. ( t-test , * p -values < 0.05). Underneath, representative images of WT and Ftx KO spleens from 3-month, 1-year and 2-year-old females. b. Representative images of hematoxylin-eosin staining on sections of spleens from 1-year-old WT and Ftx KO females. Scale bar; 100 μm. c. Representative flow cytometry analysis of splenic myeloid dendritic cells (m-DC) in WT and Ftx KO 1-year-old females. On the right, percentages of splenic m-DC (CD11b + CD11c + ) and splenic plasmacytoid dendritic cells (p-DC) (CD11c + B220 + SiglecH + ) in leucocytes. Each triangle represents a mouse. Median values are shown. ( t-test , * p -values < 0.05). d. Representative flow cytometry analysis of spontaneously activated B cells (B220 + CD69 + ) (upper panels) or of spontaneously activated T cells (CD4 + CD69 + ) (lower panels) in spleen from 1-year-old WT and Ftx KO females. Percentages in leucocytes are shown on the graphs beneath. Each triangle represents a mouse. Median values are shown. ( t-test , * p -values < 0.05). e. IgG2a natural antibody levels in sera of 1-year- and 2-year-old WT or Ftx KO females measured by ELISA. Each triangle represents a mouse. Median values are shown. ( t-test , * p -values < 0.05). f. Representative flow cytometry analysis of (B220 + CD138 + ) plasma cells in the spleen of 1-year-old WT and Ftx KO females. Percentages in leucocytes are shown on the graphs beneath. Each triangle represents a mouse. Median values are shown. ( t-test , * p -values < 0.05). g. Representative flow cytometry analysis of (CD19 + B220 lo CD5 + ) natural antibody producing B1a in the peritoneal cavity (PerC) of 1-year-old WT and Ftx KO females. Percentages in leucocytes are shown on the graphs beneath. Each triangle represents a mouse. Median values are shown. ( t-test , * p -values < 0.05). h. Cytokines levels in the blood analysed with CBA assays on sera from 3-month-, 1-year-, or 2-year-old WT and Ftx KO females. Each triangle represents a mouse. Median values are shown. ( t-test , * p -values < 0.05). i. Representative flow cytometry analysis of monocyte populations including non-classical (CD11b hi CD43 lo Ly6C + ) scavenger monocytes in the spleen of 1-year-old WT and Ftx KO females. Percentages in leucocytes are shown on the graphs beneath. Each triangle represents a mouse. Median values are shown. ( t-test , * p -values < 0.05).

Journal: bioRxiv

Article Title: Altered X-chromosome inactivation predisposes to autoimmune manifestations in mice

doi: 10.1101/2023.04.20.537662

Figure Lengend Snippet: a. Spleen weight of wild-type (WT) and Ftx KO females at 3-months, 1-year and 2-years of age. Median values are shown. ( t-test , * p -values < 0.05). Underneath, representative images of WT and Ftx KO spleens from 3-month, 1-year and 2-year-old females. b. Representative images of hematoxylin-eosin staining on sections of spleens from 1-year-old WT and Ftx KO females. Scale bar; 100 μm. c. Representative flow cytometry analysis of splenic myeloid dendritic cells (m-DC) in WT and Ftx KO 1-year-old females. On the right, percentages of splenic m-DC (CD11b + CD11c + ) and splenic plasmacytoid dendritic cells (p-DC) (CD11c + B220 + SiglecH + ) in leucocytes. Each triangle represents a mouse. Median values are shown. ( t-test , * p -values < 0.05). d. Representative flow cytometry analysis of spontaneously activated B cells (B220 + CD69 + ) (upper panels) or of spontaneously activated T cells (CD4 + CD69 + ) (lower panels) in spleen from 1-year-old WT and Ftx KO females. Percentages in leucocytes are shown on the graphs beneath. Each triangle represents a mouse. Median values are shown. ( t-test , * p -values < 0.05). e. IgG2a natural antibody levels in sera of 1-year- and 2-year-old WT or Ftx KO females measured by ELISA. Each triangle represents a mouse. Median values are shown. ( t-test , * p -values < 0.05). f. Representative flow cytometry analysis of (B220 + CD138 + ) plasma cells in the spleen of 1-year-old WT and Ftx KO females. Percentages in leucocytes are shown on the graphs beneath. Each triangle represents a mouse. Median values are shown. ( t-test , * p -values < 0.05). g. Representative flow cytometry analysis of (CD19 + B220 lo CD5 + ) natural antibody producing B1a in the peritoneal cavity (PerC) of 1-year-old WT and Ftx KO females. Percentages in leucocytes are shown on the graphs beneath. Each triangle represents a mouse. Median values are shown. ( t-test , * p -values < 0.05). h. Cytokines levels in the blood analysed with CBA assays on sera from 3-month-, 1-year-, or 2-year-old WT and Ftx KO females. Each triangle represents a mouse. Median values are shown. ( t-test , * p -values < 0.05). i. Representative flow cytometry analysis of monocyte populations including non-classical (CD11b hi CD43 lo Ly6C + ) scavenger monocytes in the spleen of 1-year-old WT and Ftx KO females. Percentages in leucocytes are shown on the graphs beneath. Each triangle represents a mouse. Median values are shown. ( t-test , * p -values < 0.05).

Article Snippet: Bone marrow, spleen, blood and peritoneal cavity cells were stained using the following antibodies: CD3 PerCP-Vio770 (130-119-656, Miltenyi Biotec), CD4-APC (130-123-207, Miltenyi Biotec), CD5-APC-Vio770 (130-120-165, Miltenyi Biotec), CD8-FITC (130-118-468, Miltenyi Biotec), CD11b APC (553312, BD Pharmingen), CD11c PE-Vio770 (130-110-840, Miltenyi Biotec), CD19-FITC (557398, BD Pharmingen), CD21-APC-Vio770 (130-111-733, Miltenyi Biotec), CD23-PE-Vio770 (130-118-764, Miltenyi Biotec), CD38-PE (130-123-571, Miltenyi Biotec), CD43-PE (130-112-887, Miltenyi Biotec), CD69-PE (130-115-575, Miltenyi Biotec), CD138 PE-Vio615 (130-108-989, Miltenyi Biotec), F4/80 FITC (130-117-509, Miltenyi Biotec), Ter119 PE (130-112-909, Miltenyi Biotec), SiglecH APC-Vio770 (130-112-299, Miltenyi Biotec), B220-APC (130-110-847, Miltenyi Biotec), B220 VioBlue (130-110-851, Miltenyi Biotec), IgM-VioBlue (130-116-318, Miltenyi Biotec), IgD-PE (130-111-496, Miltenyi Biotec), GL7-PE-Cy7 (144619, BioLegend), Ly6C-FITC (130-111-915, Miltenyi Biotec) following recommendations of the manufacturers.

Techniques: Staining, Flow Cytometry, Enzyme-linked Immunosorbent Assay, Clinical Proteomics