anti-yy1 Search Results


92
Atlas Antibodies yy1
A) Bioinformatic framework of the analyses. H3K27ac calls were split to identify approximate nucleosome-level enrichment (sub-peaks). Sub-peaks data were integrated with ENCODE-derived DHS-seq calls to identify potential sites of TF binding. Individual imputed DHS regions were assigned SI values based on the number of patient sharing the region B) Transcription factor motif analysis of individual bins (SI) followed by unsupervised clustering. RD and RN regions cluster separately in two distinct clades. ERE and <t>YY1</t> motif are blown up at the bottom C) Clonal enhancers in MCF7 cells (RI<20) are characterized by a higher number of TF footprints, while sub-clonal enhancers (RI>70) have less footprint than expected (O/E=1). Asterisks represent a pValue of <0.001 in a Wilcoxon Signed Rank Test D) Overlap of imputed DHS regions with in vivo derived ER binding sites. The left Y axis indicates cumulative DHS regions. The right Y axes indicate the percentage of overlap based on total DHS in each SI bin E) Distribution plot of in vivo derived ER binding sites versus the number of patients in which they were observed .
Yy1, supplied by Atlas Antibodies, used in various techniques. Bioz Stars score: 92/100, based on 1 PubMed citations. ZERO BIAS - scores, article reviews, protocol conditions and more
https://www.bioz.com/product/anti-yy1/Anti-YY1/bio_rxiv__193771-317-1-5
Average 92 stars, based on 1 article reviews
yy1 - by Bioz Stars, 2026-09
92/100 stars
  Buy from Supplier

93
Boster Bio pb9909
A) Bioinformatic framework of the analyses. H3K27ac calls were split to identify approximate nucleosome-level enrichment (sub-peaks). Sub-peaks data were integrated with ENCODE-derived DHS-seq calls to identify potential sites of TF binding. Individual imputed DHS regions were assigned SI values based on the number of patient sharing the region B) Transcription factor motif analysis of individual bins (SI) followed by unsupervised clustering. RD and RN regions cluster separately in two distinct clades. ERE and <t>YY1</t> motif are blown up at the bottom C) Clonal enhancers in MCF7 cells (RI<20) are characterized by a higher number of TF footprints, while sub-clonal enhancers (RI>70) have less footprint than expected (O/E=1). Asterisks represent a pValue of <0.001 in a Wilcoxon Signed Rank Test D) Overlap of imputed DHS regions with in vivo derived ER binding sites. The left Y axis indicates cumulative DHS regions. The right Y axes indicate the percentage of overlap based on total DHS in each SI bin E) Distribution plot of in vivo derived ER binding sites versus the number of patients in which they were observed .
Pb9909, supplied by Boster Bio, used in various techniques. Bioz Stars score: 93/100, based on 1 PubMed citations. ZERO BIAS - scores, article reviews, protocol conditions and more
https://www.bioz.com/product/anti-yy1/Anti-YY1+Antibody+Picoband/pm40623999-376-24-22
Average 93 stars, based on 1 article reviews
pb9909 - by Bioz Stars, 2026-09
93/100 stars
  Buy from Supplier

90
MediMabs Inc chicken anti-yy1 antibody
A) Bioinformatic framework of the analyses. H3K27ac calls were split to identify approximate nucleosome-level enrichment (sub-peaks). Sub-peaks data were integrated with ENCODE-derived DHS-seq calls to identify potential sites of TF binding. Individual imputed DHS regions were assigned SI values based on the number of patient sharing the region B) Transcription factor motif analysis of individual bins (SI) followed by unsupervised clustering. RD and RN regions cluster separately in two distinct clades. ERE and <t>YY1</t> motif are blown up at the bottom C) Clonal enhancers in MCF7 cells (RI<20) are characterized by a higher number of TF footprints, while sub-clonal enhancers (RI>70) have less footprint than expected (O/E=1). Asterisks represent a pValue of <0.001 in a Wilcoxon Signed Rank Test D) Overlap of imputed DHS regions with in vivo derived ER binding sites. The left Y axis indicates cumulative DHS regions. The right Y axes indicate the percentage of overlap based on total DHS in each SI bin E) Distribution plot of in vivo derived ER binding sites versus the number of patients in which they were observed .
Chicken Anti Yy1 Antibody, supplied by MediMabs Inc, used in various techniques. Bioz Stars score: 90/100, based on 1 PubMed citations. ZERO BIAS - scores, article reviews, protocol conditions and more
https://www.bioz.com/product/anti-yy1/chicken+anti+yy1+antibody/pmc03906247-337-71-74
Average 90 stars, based on 1 article reviews
chicken anti-yy1 antibody - by Bioz Stars, 2026-09
90/100 stars
  Buy from Supplier

90
GeneTex rabbit anti-yy1 genetex gtx110625
A) Bioinformatic framework of the analyses. H3K27ac calls were split to identify approximate nucleosome-level enrichment (sub-peaks). Sub-peaks data were integrated with ENCODE-derived DHS-seq calls to identify potential sites of TF binding. Individual imputed DHS regions were assigned SI values based on the number of patient sharing the region B) Transcription factor motif analysis of individual bins (SI) followed by unsupervised clustering. RD and RN regions cluster separately in two distinct clades. ERE and <t>YY1</t> motif are blown up at the bottom C) Clonal enhancers in MCF7 cells (RI<20) are characterized by a higher number of TF footprints, while sub-clonal enhancers (RI>70) have less footprint than expected (O/E=1). Asterisks represent a pValue of <0.001 in a Wilcoxon Signed Rank Test D) Overlap of imputed DHS regions with in vivo derived ER binding sites. The left Y axis indicates cumulative DHS regions. The right Y axes indicate the percentage of overlap based on total DHS in each SI bin E) Distribution plot of in vivo derived ER binding sites versus the number of patients in which they were observed .
Rabbit Anti Yy1 Genetex Gtx110625, supplied by GeneTex, used in various techniques. Bioz Stars score: 90/100, based on 1 PubMed citations. ZERO BIAS - scores, article reviews, protocol conditions and more
https://www.bioz.com/product/anti-yy1/rabbit+anti+yy1/bio_rxiv__2023__04__10__536149-167-33-35
Average 90 stars, based on 1 article reviews
rabbit anti-yy1 genetex gtx110625 - by Bioz Stars, 2026-09
90/100 stars
  Buy from Supplier

90
DIAGENODE DIAGNOSTICS anti-yy1 antibody
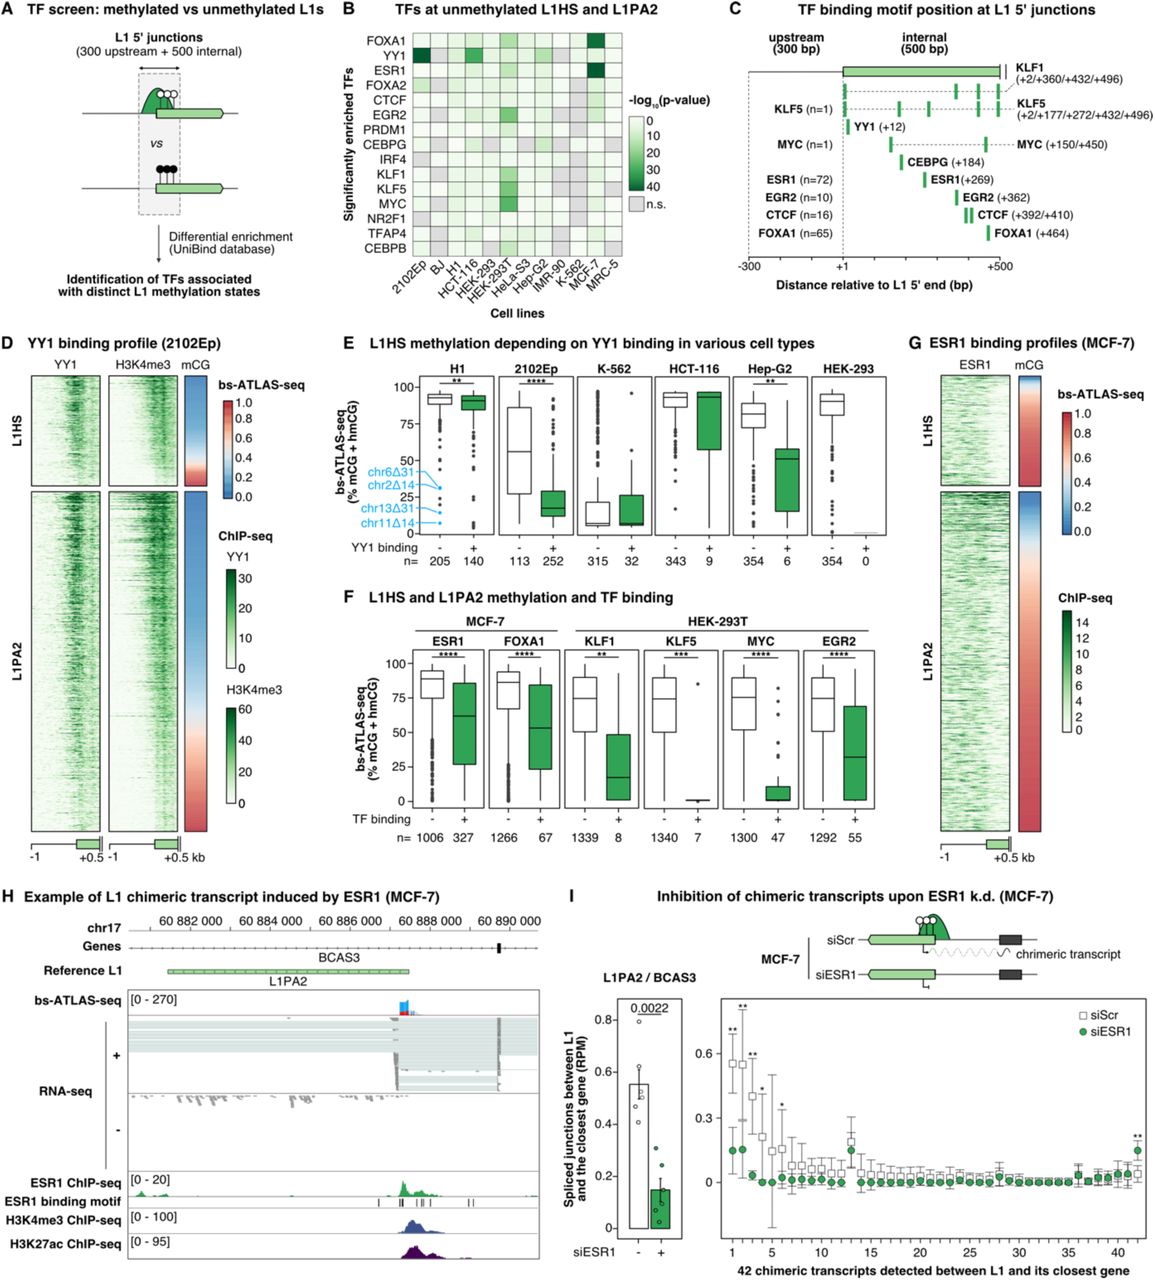
(A) Screening strategy to identify TFs differentially associated between unmethylated and methylated L1HS and L1PA2 copies using curated datasets publicly available in the UniBind database . Note that for each cell line in our panel, we compared each pair of methylated and unmethylated L1 subsets to all ChIP-seq data stored in Unibind (∼3500 datasets), irrespective of the cell-type or conditions in which they were obtained. The rationale was that even if our specific cell line is not necessarily represented in Unibind datasets, a similar cell type may be represented. The main hits were then subsequently confirmed using matched datasets (see panels E and F). (B) Heatmap showing the TF binding enrichment at hypomethylated L1HS and L1PA2 in our panel of cell types. Only the 15 most enriched TFs are shown. (C) Schematic representation of the location of the motifs corresponding to the TFs identified in (B). For TFs binding upstream of L1 insertions, the number of loci with an upstream peak is indicated. (D) Heatmap displaying L1 methylation (bs-ATLAS-seq), as well as <t>YY1</t> and H3K4me3 binding (ChIP-seq), at the 5’ junction (−1 to +0.5 kb) of L1HS and L1PA2 elements in 2102Ep cells. Loci are sorted by increasing levels of L1 methylation. ChIP-seq signal represents the number of normalized reads per 10-bp bin. (E) DNA methylation level of L1HS bound (+) or unbound (-) by YY1 in embryonal cell lines (H1 and 2102Ep) and other cell lines for which matched YY1 ChIP-seq were also publicly available (K562, HCT116, HepG2, HEK-293T). The number of L1HS copies in each subset (n) is indicated at the bottom of the plot. In H1 cells, the four hypomethylated loci in blue refer to those studied in . (F) DNA methylation levels of L1HS and L1PA2 loci bound (+) or not bound (-) by ESR1, FOXA1, KLF1, KLF5, Myc and EGFR2 in the relevant cell types. ChIP-seq data are matched to the cell line. The number of L1HS copies in each subset (n) is indicated at the bottom of the plot. (G) Heatmap displaying L1 methylation (bs-ATLAS-seq), as well as ESR1 binding (ChIP-seq), at the 5’ junction (−1 to +0.5 kb) of L1HS and L1PA2 elements in MCF-7 cells. Loci are sorted by increasing levels of L1 methylation. ChIP-seq signal represents the number of normalized reads per 10-bp bin. (H) Genome browser view of the BCAS3 locus integrating L1 methylation (bs-ATLAS-seq), expression (poly(A) + RNA-seq), ESR1 binding, as well as H3K4me3 and H3K27ac histone modifications (ChIP-seq). Note the distinctive spliced RNA-seq reads, antisense relative to the L1 element, linking L1 antisense promoter with the adjacent BCAS3 exon. (I) SiRNA-mediated knock-down of ESR1 leads to reduced L1 chimeric transcripts. Top, schematic representation of chimeric transcripts initiated from L1 antisense promoter and leading to truncated or alternative isoforms of the surrounding gene. Upon siRNA-mediated knock down (siESR1), the number of L1 chimeric splice junctions is expected to decrease if ESR1 drives chimeric transcript synthesis, as compared to a scrambled siRNA control (siScr). Bottom left, chimeric transcripts at the BCAS3 locus quantified by the number of normalized spliced-RNA-seq reads (RPM) detected in MCF-7 cells treated by an siRNA against ESR1 (+) or a control scrambled siRNA (-) (data from GSE153250). Bars represent the mean ± s.d. (n=6) and are overlaid by data of individual replicates (one-sided two-sample Wilcoxon test). Bottom right, average chimeric transcripts quantified as the normalized number of splice junctions between L1 and its closest gene in RPM for 42 loci (n=6, mean ± s.d.). The 42 loci are sorted by descending order according to the difference of chimeric transcript levels between cells treated by siESR1 and the control siScr. For 37 loci out of 42 (88%), L1 chimeric transcription is reduced upon ESR1 knock down. The difference is statistically significant for 5 loci (one-sided two-sample Wilcoxon test). In panels (E) and (F), boxplots represent the median and interquartile range (IQR) ± 1.5 * IQR (whiskers). Outliers beyond the end of the whiskers are plotted individually. *p < 0.05, **p < 0.01, ***p < 0.001, and ****p < 0.0001, two-sided two-sample Wilcoxon test. See also .
Anti Yy1 Antibody, supplied by DIAGENODE DIAGNOSTICS, used in various techniques. Bioz Stars score: 90/100, based on 1 PubMed citations. ZERO BIAS - scores, article reviews, protocol conditions and more
https://www.bioz.com/product/anti-yy1/anti+yy1+antibody+c15410345/bio_rxiv__2023__01__03__522582-387-26-29
Average 90 stars, based on 1 article reviews
anti-yy1 antibody - by Bioz Stars, 2026-09
90/100 stars
  Buy from Supplier

90
GenScript corporation anti-yy1 k411me1 antibody
( A,B ) In vitro methylation assay was performed by mixing purified bacterially-expressed His-tagged <t>YY1</t> protein with various protein lysine methyltransferases (KMTs), either full length (FL) or truncations with enzymatic domain, from bacterial cells ( A ) or HEK293T cells with over-expression ( B ) as indicated, followed by autoradiogram. Wild-type: wt; Enzymatically dead mutant: m. White arrows indicate automethylation (auto-me) of KMTs; Black arrows indicate methylation of YY1 (YY1(me)). ( C ) Schematic representation of the domain architecture of YY1 protein. Amino acid information for the three linker regions, aa321–324, 347–352 and 377–382, between Zn fingers as well as the very carboxyl-terminus was depicted. Acidic Region (light green); His-cluster (yellow); GA-rich region (light blue); GK-rich region (blue); Spacer (dark blue); Zn finger (purple); Linker region (black); The very carboxyl-terminus (red). ( D ) In vitro methylation assay was performed by mixing purified bacterially-expressed His-tagged SET7/9 protein with YY1 amino-terminus (1-266) or carboxyl-terminus (267-414), followed by autoradiogram (top panel). The expression of YY1(1-266) and YY1(267-414) was examined by coomassie blue staining (C.B.S) (bottom panel). ( E ) In vitro methylation assay was performed by mixing purified bacterially-expressed His-tagged SET7/9 with YY1(1-266) wild type (wt) or its mutant form with substitution of lysine 173 to arginine (K173R), followed by autoradiogram (top panel). The expression of YY1(1-266)(wt) and K173R was examined by C.B.S (bottom panel). ( F ) In vitro methylation assay was performed by mixing purified bacterially-expressed His-tagged SET7/9 with YY1(267-414) wild type (wt) or its mutant form with substitution of lysine 288, 305, 339, 341 or 411 to arginine (K288R, K305R, K339R, K341R or K411R), followed by autoradiogram (top panel). The expression of YY1(267-414)(wt), K288R, K305R, K339R, K341R and K411R was examined by C.B.S (bottom panel). ( G ) In vitro methylation assay was performed by mixing short peptides containing unmodified (K173 or K411) or mono-methylated K173 or K411 (K173me1 or <t>K411me1)</t> with or without purified bacterially-expressed SET7/9 proteins. Increased amount of each reaction was taken for dot blot as indicated, followed by autoradiogram.
Anti Yy1 K411me1 Antibody, supplied by GenScript corporation, used in various techniques. Bioz Stars score: 90/100, based on 1 PubMed citations. ZERO BIAS - scores, article reviews, protocol conditions and more
https://www.bioz.com/product/anti-yy1/anti+yy1+k173me1+antibody/pmc04763200-136-3-9
Average 90 stars, based on 1 article reviews
anti-yy1 k411me1 antibody - by Bioz Stars, 2026-09
90/100 stars
  Buy from Supplier

90
FUJIFILM anti-yy1 antibody
( A,B ) In vitro methylation assay was performed by mixing purified bacterially-expressed His-tagged <t>YY1</t> protein with various protein lysine methyltransferases (KMTs), either full length (FL) or truncations with enzymatic domain, from bacterial cells ( A ) or HEK293T cells with over-expression ( B ) as indicated, followed by autoradiogram. Wild-type: wt; Enzymatically dead mutant: m. White arrows indicate automethylation (auto-me) of KMTs; Black arrows indicate methylation of YY1 (YY1(me)). ( C ) Schematic representation of the domain architecture of YY1 protein. Amino acid information for the three linker regions, aa321–324, 347–352 and 377–382, between Zn fingers as well as the very carboxyl-terminus was depicted. Acidic Region (light green); His-cluster (yellow); GA-rich region (light blue); GK-rich region (blue); Spacer (dark blue); Zn finger (purple); Linker region (black); The very carboxyl-terminus (red). ( D ) In vitro methylation assay was performed by mixing purified bacterially-expressed His-tagged SET7/9 protein with YY1 amino-terminus (1-266) or carboxyl-terminus (267-414), followed by autoradiogram (top panel). The expression of YY1(1-266) and YY1(267-414) was examined by coomassie blue staining (C.B.S) (bottom panel). ( E ) In vitro methylation assay was performed by mixing purified bacterially-expressed His-tagged SET7/9 with YY1(1-266) wild type (wt) or its mutant form with substitution of lysine 173 to arginine (K173R), followed by autoradiogram (top panel). The expression of YY1(1-266)(wt) and K173R was examined by C.B.S (bottom panel). ( F ) In vitro methylation assay was performed by mixing purified bacterially-expressed His-tagged SET7/9 with YY1(267-414) wild type (wt) or its mutant form with substitution of lysine 288, 305, 339, 341 or 411 to arginine (K288R, K305R, K339R, K341R or K411R), followed by autoradiogram (top panel). The expression of YY1(267-414)(wt), K288R, K305R, K339R, K341R and K411R was examined by C.B.S (bottom panel). ( G ) In vitro methylation assay was performed by mixing short peptides containing unmodified (K173 or K411) or mono-methylated K173 or K411 (K173me1 or <t>K411me1)</t> with or without purified bacterially-expressed SET7/9 proteins. Increased amount of each reaction was taken for dot blot as indicated, followed by autoradiogram.
Anti Yy1 Antibody, supplied by FUJIFILM, used in various techniques. Bioz Stars score: 90/100, based on 1 PubMed citations. ZERO BIAS - scores, article reviews, protocol conditions and more
https://www.bioz.com/product/anti-yy1/anti+yy1+antibody/pm30251328-179-8-21
Average 90 stars, based on 1 article reviews
anti-yy1 antibody - by Bioz Stars, 2026-09
90/100 stars
  Buy from Supplier

90
Cascade BioScience human anti-yy1 mab
Apoptotic cell analysis by AO staining and TUNEL assay. Control-MO and <t>YY1-MO</t> (25 ng per embryo) were injected at the one-cell stage to block translation of YY1a mRNA. The embryos were fixed and observed at the different stages postfertilization (pf). The AO-stained embryos are shown in a (Control-MO; 18.5 hpf), b (YY1-MO; 18.5 hpf), c (Control-MO; 18.5 hpf; enlarged from A), and d (YY1-MO; 18.5 hpf; enlarged from B; strongly AO-positive cells indicated by arrows). TUNEL stained embryos (all at 18.5 hpf) are shown in e (Control-MO) and f (YY1-MO group). Identification of apoptotic cell death-related gene P53 at 18.5 hpf by qRT-PCR approach as a control is shown in ( g ). All data were analyzed using either paired or unpaired Student’s t-tests as appropriate. * P < 0.01. The TUNEL-positive cells under the fluorescence microscope are considered apoptotic. Bars indicate 100 μm
Human Anti Yy1 Mab, supplied by Cascade BioScience, used in various techniques. Bioz Stars score: 90/100, based on 1 PubMed citations. ZERO BIAS - scores, article reviews, protocol conditions and more
https://www.bioz.com/product/anti-yy1/human+anti+yy1+mab/pmc04770675-64-6-9
Average 90 stars, based on 1 article reviews
human anti-yy1 mab - by Bioz Stars, 2026-09
90/100 stars
  Buy from Supplier

93
Boster Bio anti yy1
Apoptotic cell analysis by AO staining and TUNEL assay. Control-MO and <t>YY1-MO</t> (25 ng per embryo) were injected at the one-cell stage to block translation of YY1a mRNA. The embryos were fixed and observed at the different stages postfertilization (pf). The AO-stained embryos are shown in a (Control-MO; 18.5 hpf), b (YY1-MO; 18.5 hpf), c (Control-MO; 18.5 hpf; enlarged from A), and d (YY1-MO; 18.5 hpf; enlarged from B; strongly AO-positive cells indicated by arrows). TUNEL stained embryos (all at 18.5 hpf) are shown in e (Control-MO) and f (YY1-MO group). Identification of apoptotic cell death-related gene P53 at 18.5 hpf by qRT-PCR approach as a control is shown in ( g ). All data were analyzed using either paired or unpaired Student’s t-tests as appropriate. * P < 0.01. The TUNEL-positive cells under the fluorescence microscope are considered apoptotic. Bars indicate 100 μm
Anti Yy1, supplied by Boster Bio, used in various techniques. Bioz Stars score: 93/100, based on 1 PubMed citations. ZERO BIAS - scores, article reviews, protocol conditions and more
https://www.bioz.com/product/anti-yy1/Anti-YY1+Antibody/pm39182383-97-19-22
Average 93 stars, based on 1 article reviews
anti yy1 - by Bioz Stars, 2026-09
93/100 stars
  Buy from Supplier

90
ImmunoWay Biotechnology Company anti-yy1 yn2287
Apoptotic cell analysis by AO staining and TUNEL assay. Control-MO and <t>YY1-MO</t> (25 ng per embryo) were injected at the one-cell stage to block translation of YY1a mRNA. The embryos were fixed and observed at the different stages postfertilization (pf). The AO-stained embryos are shown in a (Control-MO; 18.5 hpf), b (YY1-MO; 18.5 hpf), c (Control-MO; 18.5 hpf; enlarged from A), and d (YY1-MO; 18.5 hpf; enlarged from B; strongly AO-positive cells indicated by arrows). TUNEL stained embryos (all at 18.5 hpf) are shown in e (Control-MO) and f (YY1-MO group). Identification of apoptotic cell death-related gene P53 at 18.5 hpf by qRT-PCR approach as a control is shown in ( g ). All data were analyzed using either paired or unpaired Student’s t-tests as appropriate. * P < 0.01. The TUNEL-positive cells under the fluorescence microscope are considered apoptotic. Bars indicate 100 μm
Anti Yy1 Yn2287, supplied by ImmunoWay Biotechnology Company, used in various techniques. Bioz Stars score: 90/100, based on 1 PubMed citations. ZERO BIAS - scores, article reviews, protocol conditions and more
https://www.bioz.com/product/anti-yy1/anti+yy1+yn2287/pm37211173-77-39-41
Average 90 stars, based on 1 article reviews
anti-yy1 yn2287 - by Bioz Stars, 2026-09
90/100 stars
  Buy from Supplier

92
Bio-Techne corporation human/mouse yy1 antibody
Apoptotic cell analysis by AO staining and TUNEL assay. Control-MO and <t>YY1-MO</t> (25 ng per embryo) were injected at the one-cell stage to block translation of YY1a mRNA. The embryos were fixed and observed at the different stages postfertilization (pf). The AO-stained embryos are shown in a (Control-MO; 18.5 hpf), b (YY1-MO; 18.5 hpf), c (Control-MO; 18.5 hpf; enlarged from A), and d (YY1-MO; 18.5 hpf; enlarged from B; strongly AO-positive cells indicated by arrows). TUNEL stained embryos (all at 18.5 hpf) are shown in e (Control-MO) and f (YY1-MO group). Identification of apoptotic cell death-related gene P53 at 18.5 hpf by qRT-PCR approach as a control is shown in ( g ). All data were analyzed using either paired or unpaired Student’s t-tests as appropriate. * P < 0.01. The TUNEL-positive cells under the fluorescence microscope are considered apoptotic. Bars indicate 100 μm
Human/Mouse Yy1 Antibody, supplied by Bio-Techne corporation, used in various techniques. Bioz Stars score: 92/100, based on 1 PubMed citations. ZERO BIAS - scores, article reviews, protocol conditions and more
https://www.bioz.com/product/anti-yy1/Human%2FMouse+YY1+Antibody/bio-techne+corporation___mab3784
Average 92 stars, based on 1 article reviews
human/mouse yy1 antibody - by Bioz Stars, 2026-09
92/100 stars
  Buy from Supplier

86
Epizyme Inc antibodies against yy1
Apoptotic cell analysis by AO staining and TUNEL assay. Control-MO and <t>YY1-MO</t> (25 ng per embryo) were injected at the one-cell stage to block translation of YY1a mRNA. The embryos were fixed and observed at the different stages postfertilization (pf). The AO-stained embryos are shown in a (Control-MO; 18.5 hpf), b (YY1-MO; 18.5 hpf), c (Control-MO; 18.5 hpf; enlarged from A), and d (YY1-MO; 18.5 hpf; enlarged from B; strongly AO-positive cells indicated by arrows). TUNEL stained embryos (all at 18.5 hpf) are shown in e (Control-MO) and f (YY1-MO group). Identification of apoptotic cell death-related gene P53 at 18.5 hpf by qRT-PCR approach as a control is shown in ( g ). All data were analyzed using either paired or unpaired Student’s t-tests as appropriate. * P < 0.01. The TUNEL-positive cells under the fluorescence microscope are considered apoptotic. Bars indicate 100 μm
Antibodies Against Yy1, supplied by Epizyme Inc, used in various techniques. Bioz Stars score: 86/100, based on 1 PubMed citations. ZERO BIAS - scores, article reviews, protocol conditions and more
https://www.bioz.com/product/anti-yy1/anti+yy1/pm41480166-90-6-11
Average 86 stars, based on 1 article reviews
antibodies against yy1 - by Bioz Stars, 2026-09
86/100 stars
  Buy from Supplier

Image Search Results


A) Bioinformatic framework of the analyses. H3K27ac calls were split to identify approximate nucleosome-level enrichment (sub-peaks). Sub-peaks data were integrated with ENCODE-derived DHS-seq calls to identify potential sites of TF binding. Individual imputed DHS regions were assigned SI values based on the number of patient sharing the region B) Transcription factor motif analysis of individual bins (SI) followed by unsupervised clustering. RD and RN regions cluster separately in two distinct clades. ERE and YY1 motif are blown up at the bottom C) Clonal enhancers in MCF7 cells (RI<20) are characterized by a higher number of TF footprints, while sub-clonal enhancers (RI>70) have less footprint than expected (O/E=1). Asterisks represent a pValue of <0.001 in a Wilcoxon Signed Rank Test D) Overlap of imputed DHS regions with in vivo derived ER binding sites. The left Y axis indicates cumulative DHS regions. The right Y axes indicate the percentage of overlap based on total DHS in each SI bin E) Distribution plot of in vivo derived ER binding sites versus the number of patients in which they were observed .

Journal: bioRxiv

Article Title: Enhancers mapping uncovers phenotypic heterogeneity and evolution in patients with luminal breast cancer

doi: 10.1101/193771

Figure Lengend Snippet: A) Bioinformatic framework of the analyses. H3K27ac calls were split to identify approximate nucleosome-level enrichment (sub-peaks). Sub-peaks data were integrated with ENCODE-derived DHS-seq calls to identify potential sites of TF binding. Individual imputed DHS regions were assigned SI values based on the number of patient sharing the region B) Transcription factor motif analysis of individual bins (SI) followed by unsupervised clustering. RD and RN regions cluster separately in two distinct clades. ERE and YY1 motif are blown up at the bottom C) Clonal enhancers in MCF7 cells (RI<20) are characterized by a higher number of TF footprints, while sub-clonal enhancers (RI>70) have less footprint than expected (O/E=1). Asterisks represent a pValue of <0.001 in a Wilcoxon Signed Rank Test D) Overlap of imputed DHS regions with in vivo derived ER binding sites. The left Y axis indicates cumulative DHS regions. The right Y axes indicate the percentage of overlap based on total DHS in each SI bin E) Distribution plot of in vivo derived ER binding sites versus the number of patients in which they were observed .

Article Snippet: For YY1 (Protein Atlas HPA001119, Atlas Antibodies Cat#HPA001119, RRID:AB_1858930 ) the flowing conditions were used: tissue sections were incubated with the primary monoclonal. overnight at 4°C, and chromogen development was performed using the Envision system (DAKO Corporation, Glostrup, Denmark).

Techniques: Derivative Assay, Binding Assay, In Vivo

A) RIs for the YY1 enhancer within all the individual patients included in the current study. YY1 enhancer location with its 3D interactions are shown in the top right inset B) YY1 enhancer ranking analysis of available Epigenome Roadmap H3K27ac datasets. Tissues are displayed from the strongest to the weakest YY1 enhancer activity (based on RI). Representative IHC analysis of normal tissues stained with a YY1 antibody are shown C) Top left: YY1 expression in ER-positive breast cancer compared to normal breast tissue. Bottom left: Kaplan-Meier analysis of patient outcome using YY1 expression to stratify patients. Right: Kaplan-Meier analysis of patient outcome using YY1 expression. All BC subtypes were analysed separately D) IHC analysis of normal breast tissues highlights YY1 functional subclones in normal breast E) IHC analysis of ER positive invasive ductal carcinomas identify YY1 positive clones as the dominant clonal population.

Journal: bioRxiv

Article Title: Enhancers mapping uncovers phenotypic heterogeneity and evolution in patients with luminal breast cancer

doi: 10.1101/193771

Figure Lengend Snippet: A) RIs for the YY1 enhancer within all the individual patients included in the current study. YY1 enhancer location with its 3D interactions are shown in the top right inset B) YY1 enhancer ranking analysis of available Epigenome Roadmap H3K27ac datasets. Tissues are displayed from the strongest to the weakest YY1 enhancer activity (based on RI). Representative IHC analysis of normal tissues stained with a YY1 antibody are shown C) Top left: YY1 expression in ER-positive breast cancer compared to normal breast tissue. Bottom left: Kaplan-Meier analysis of patient outcome using YY1 expression to stratify patients. Right: Kaplan-Meier analysis of patient outcome using YY1 expression. All BC subtypes were analysed separately D) IHC analysis of normal breast tissues highlights YY1 functional subclones in normal breast E) IHC analysis of ER positive invasive ductal carcinomas identify YY1 positive clones as the dominant clonal population.

Article Snippet: For YY1 (Protein Atlas HPA001119, Atlas Antibodies Cat#HPA001119, RRID:AB_1858930 ) the flowing conditions were used: tissue sections were incubated with the primary monoclonal. overnight at 4°C, and chromogen development was performed using the Envision system (DAKO Corporation, Glostrup, Denmark).

Techniques: Activity Assay, Staining, Expressing, Functional Assay, Clone Assay

A) ChIP-seq data from ER-positive MCF7 for YY1 in quiescent or 17ß-estradiol (E2) stimulated cells B) Heatmaps showing global enrichment profiles of several chromatin markers associated with active regulatory regions in MCF7 cells C) Overlap between ER, YY1 and FOXA1 in MCF7 cells. The right panel shows the potential overlap with in vivo- derived core ER binding sites D) ER core binding sites are strongly enriched for YY1 binding in MCF7 cells while patient-specific ER bindings are generally YY1-free. E) Genes used to classify luminal breast cancer patients are strongly enriched for ER-YY1 binding sites. Asterisks represent p<10 −5 in a Fisher’s Exact test vs. private ER F) YY1 depletion leads to transcriptional shut-down of an ERE-driven luciferase reporter. Bars and error bars represent the average of 5 independent experiments with SE. Asterisks represent significance at P<0.001 after ANOVA with Dunnet’s correction. G) Silencing YY1 blocks estrogen-induced growth in MCF7 cells H) YY1 depletion leads to growth arrest in AI resistant LTED cells. Proliferation assays were conducted in biological triplicate. Error bars indicate 95% confidence intervals. Asterisks represent significance at P<0.05, 0.01, 0.001 and 0.0001 after 2-way ANOVA with Tukey’s post-test I) Overlap of YY1 and ER binding sites in LTED cell lines J) ER-YY1 bound enhancers in LTED cells underlie the transcription of genes associated with luminal breast cancer and acquired endocrine therapy resistance K) core ER-YY1 bound enhancers are strongly enriched near estrogen responsive genes that are not suppressed by Tamoxifen co-treatment.

Journal: bioRxiv

Article Title: Enhancers mapping uncovers phenotypic heterogeneity and evolution in patients with luminal breast cancer

doi: 10.1101/193771

Figure Lengend Snippet: A) ChIP-seq data from ER-positive MCF7 for YY1 in quiescent or 17ß-estradiol (E2) stimulated cells B) Heatmaps showing global enrichment profiles of several chromatin markers associated with active regulatory regions in MCF7 cells C) Overlap between ER, YY1 and FOXA1 in MCF7 cells. The right panel shows the potential overlap with in vivo- derived core ER binding sites D) ER core binding sites are strongly enriched for YY1 binding in MCF7 cells while patient-specific ER bindings are generally YY1-free. E) Genes used to classify luminal breast cancer patients are strongly enriched for ER-YY1 binding sites. Asterisks represent p<10 −5 in a Fisher’s Exact test vs. private ER F) YY1 depletion leads to transcriptional shut-down of an ERE-driven luciferase reporter. Bars and error bars represent the average of 5 independent experiments with SE. Asterisks represent significance at P<0.001 after ANOVA with Dunnet’s correction. G) Silencing YY1 blocks estrogen-induced growth in MCF7 cells H) YY1 depletion leads to growth arrest in AI resistant LTED cells. Proliferation assays were conducted in biological triplicate. Error bars indicate 95% confidence intervals. Asterisks represent significance at P<0.05, 0.01, 0.001 and 0.0001 after 2-way ANOVA with Tukey’s post-test I) Overlap of YY1 and ER binding sites in LTED cell lines J) ER-YY1 bound enhancers in LTED cells underlie the transcription of genes associated with luminal breast cancer and acquired endocrine therapy resistance K) core ER-YY1 bound enhancers are strongly enriched near estrogen responsive genes that are not suppressed by Tamoxifen co-treatment.

Article Snippet: For YY1 (Protein Atlas HPA001119, Atlas Antibodies Cat#HPA001119, RRID:AB_1858930 ) the flowing conditions were used: tissue sections were incubated with the primary monoclonal. overnight at 4°C, and chromogen development was performed using the Envision system (DAKO Corporation, Glostrup, Denmark).

Techniques: ChIP-sequencing, In Vivo, Derivative Assay, Binding Assay, Luciferase

A) Global Kaplan-Meier analysis summarize univariate analysis for each gene included in the Affymetrix microarray platform. Hazard Ratios are plotted in the X axis B) SLC9A3R1 RNA levels pre- and post-short-term aromatase inhibitor treatment in responder and non-responder patients . Oestrogen-dependent expression of progesterone receptor mRNA is shown as comparison C) Silencing SLC9A3R1 leads to proliferation arrest in response to estrogen stimulation in MCF7 and estrogen independent growth in LTED cells. Proliferation assays were conducted in biological triplicate. Error bars indicate 95% confidence intervals. Asterisks represent significance at P<0.05, 0.01, 0.001 and 0.0001 after 2-way ANOVA with Tukey’s post-test D) RIs for the SLC9A3R1 enhancer within all the individual patients included in the current study. SLC9A3R1 enhancer location and its 3D interactions are shown in the top right inset E) SLC9A3R1 enhancer ranking analysis of available Epigenome Roadmap H3K27ac datasets. Tissues are displayed from the strongest to the weakest SLC9A3R1 enhancer activity (based on RI). Representative IHC analysis of normal tissues stained with a SLC9A3R1 antibody are shown. F-G) YY1 and SLC9A3R1 IHC analysis of BC patients profiled using H3K27ac ChIP-seq. Predicted activity (RI) of YY and SLC9A3R1 enhancers is shown on the X axis. The number of cells positively stained for YY1 and SLC9A3R1 protein is indicated on the Y axis. Linear regression R square, confidence intervals and representative staining are also shown.

Journal: bioRxiv

Article Title: Enhancers mapping uncovers phenotypic heterogeneity and evolution in patients with luminal breast cancer

doi: 10.1101/193771

Figure Lengend Snippet: A) Global Kaplan-Meier analysis summarize univariate analysis for each gene included in the Affymetrix microarray platform. Hazard Ratios are plotted in the X axis B) SLC9A3R1 RNA levels pre- and post-short-term aromatase inhibitor treatment in responder and non-responder patients . Oestrogen-dependent expression of progesterone receptor mRNA is shown as comparison C) Silencing SLC9A3R1 leads to proliferation arrest in response to estrogen stimulation in MCF7 and estrogen independent growth in LTED cells. Proliferation assays were conducted in biological triplicate. Error bars indicate 95% confidence intervals. Asterisks represent significance at P<0.05, 0.01, 0.001 and 0.0001 after 2-way ANOVA with Tukey’s post-test D) RIs for the SLC9A3R1 enhancer within all the individual patients included in the current study. SLC9A3R1 enhancer location and its 3D interactions are shown in the top right inset E) SLC9A3R1 enhancer ranking analysis of available Epigenome Roadmap H3K27ac datasets. Tissues are displayed from the strongest to the weakest SLC9A3R1 enhancer activity (based on RI). Representative IHC analysis of normal tissues stained with a SLC9A3R1 antibody are shown. F-G) YY1 and SLC9A3R1 IHC analysis of BC patients profiled using H3K27ac ChIP-seq. Predicted activity (RI) of YY and SLC9A3R1 enhancers is shown on the X axis. The number of cells positively stained for YY1 and SLC9A3R1 protein is indicated on the Y axis. Linear regression R square, confidence intervals and representative staining are also shown.

Article Snippet: For YY1 (Protein Atlas HPA001119, Atlas Antibodies Cat#HPA001119, RRID:AB_1858930 ) the flowing conditions were used: tissue sections were incubated with the primary monoclonal. overnight at 4°C, and chromogen development was performed using the Envision system (DAKO Corporation, Glostrup, Denmark).

Techniques: Microarray, Expressing, Comparison, Activity Assay, Staining, ChIP-sequencing

A) Theoretical framework of the analysis. The relative size of phenotypic clones can be tracked using enhancer activity (RIs). Phenotypic clones can be positively or negatively selected during BC progression in response to endocrine therapies. B) Expanding or contracting phenotypic clones were defined based on the RI-ratio in primary and metastatic samples (RI P /RI M ). Distribution of RI-ratio identified top candidate enhancers YY1 RI does not change significantly during progression, while SLC9A3R1 RI ranks among the enhancers with stronger increase in activity during progression. Vertical bars represent (Standard Deviation) increments from the population median C) Scatterplot of YY1 and SLC9A3R1 enhancer ranking according to patient stage. Bars indicate mean and 95% confidence intervals. Asterisks represent significance at P<0.05 after students two-tail T-Test D) IHC staining for YY1 and SLC9A3R1 positive cells in an independent matched longitudinal cohort of ER breast cancer patients. All normal and primaries are treatment naïve. All metastatic have received endocrine therapies (Tamoxifen or Aromatase inhibitors). Statistical significance was calculated using a pair-wise, two-tail T-test. Representative images are also shown E) Enhancer and promoter stratification based on frequency of usage in primary and metastatic patients. Percentages were calculated for each regulatory region for each stage (primary and metastatic) and differential was then derived and plotted on the X-axis F) RI indexes for all PE and ME are plotted. As a control, RI for common enhancer (CE) are also plotted. Permutation was used to assess changes in RI in 50 randomly selected sets of CE G) Kaplan-Meier analysis using averaged RNA expression of genes associated with PE or ME regulatory regions. Genes were assigned considering CTCF insulated perimeters E) Pathway analysis for genes associated with PE or ME regulatory regions. Pathways were identified using GREAT and are listed in order of significance (qValue).

Journal: bioRxiv

Article Title: Enhancers mapping uncovers phenotypic heterogeneity and evolution in patients with luminal breast cancer

doi: 10.1101/193771

Figure Lengend Snippet: A) Theoretical framework of the analysis. The relative size of phenotypic clones can be tracked using enhancer activity (RIs). Phenotypic clones can be positively or negatively selected during BC progression in response to endocrine therapies. B) Expanding or contracting phenotypic clones were defined based on the RI-ratio in primary and metastatic samples (RI P /RI M ). Distribution of RI-ratio identified top candidate enhancers YY1 RI does not change significantly during progression, while SLC9A3R1 RI ranks among the enhancers with stronger increase in activity during progression. Vertical bars represent (Standard Deviation) increments from the population median C) Scatterplot of YY1 and SLC9A3R1 enhancer ranking according to patient stage. Bars indicate mean and 95% confidence intervals. Asterisks represent significance at P<0.05 after students two-tail T-Test D) IHC staining for YY1 and SLC9A3R1 positive cells in an independent matched longitudinal cohort of ER breast cancer patients. All normal and primaries are treatment naïve. All metastatic have received endocrine therapies (Tamoxifen or Aromatase inhibitors). Statistical significance was calculated using a pair-wise, two-tail T-test. Representative images are also shown E) Enhancer and promoter stratification based on frequency of usage in primary and metastatic patients. Percentages were calculated for each regulatory region for each stage (primary and metastatic) and differential was then derived and plotted on the X-axis F) RI indexes for all PE and ME are plotted. As a control, RI for common enhancer (CE) are also plotted. Permutation was used to assess changes in RI in 50 randomly selected sets of CE G) Kaplan-Meier analysis using averaged RNA expression of genes associated with PE or ME regulatory regions. Genes were assigned considering CTCF insulated perimeters E) Pathway analysis for genes associated with PE or ME regulatory regions. Pathways were identified using GREAT and are listed in order of significance (qValue).

Article Snippet: For YY1 (Protein Atlas HPA001119, Atlas Antibodies Cat#HPA001119, RRID:AB_1858930 ) the flowing conditions were used: tissue sections were incubated with the primary monoclonal. overnight at 4°C, and chromogen development was performed using the Envision system (DAKO Corporation, Glostrup, Denmark).

Techniques: Clone Assay, Activity Assay, Standard Deviation, Immunohistochemistry, Derivative Assay, Control, RNA Expression

(A) Screening strategy to identify TFs differentially associated between unmethylated and methylated L1HS and L1PA2 copies using curated datasets publicly available in the UniBind database . Note that for each cell line in our panel, we compared each pair of methylated and unmethylated L1 subsets to all ChIP-seq data stored in Unibind (∼3500 datasets), irrespective of the cell-type or conditions in which they were obtained. The rationale was that even if our specific cell line is not necessarily represented in Unibind datasets, a similar cell type may be represented. The main hits were then subsequently confirmed using matched datasets (see panels E and F). (B) Heatmap showing the TF binding enrichment at hypomethylated L1HS and L1PA2 in our panel of cell types. Only the 15 most enriched TFs are shown. (C) Schematic representation of the location of the motifs corresponding to the TFs identified in (B). For TFs binding upstream of L1 insertions, the number of loci with an upstream peak is indicated. (D) Heatmap displaying L1 methylation (bs-ATLAS-seq), as well as YY1 and H3K4me3 binding (ChIP-seq), at the 5’ junction (−1 to +0.5 kb) of L1HS and L1PA2 elements in 2102Ep cells. Loci are sorted by increasing levels of L1 methylation. ChIP-seq signal represents the number of normalized reads per 10-bp bin. (E) DNA methylation level of L1HS bound (+) or unbound (-) by YY1 in embryonal cell lines (H1 and 2102Ep) and other cell lines for which matched YY1 ChIP-seq were also publicly available (K562, HCT116, HepG2, HEK-293T). The number of L1HS copies in each subset (n) is indicated at the bottom of the plot. In H1 cells, the four hypomethylated loci in blue refer to those studied in . (F) DNA methylation levels of L1HS and L1PA2 loci bound (+) or not bound (-) by ESR1, FOXA1, KLF1, KLF5, Myc and EGFR2 in the relevant cell types. ChIP-seq data are matched to the cell line. The number of L1HS copies in each subset (n) is indicated at the bottom of the plot. (G) Heatmap displaying L1 methylation (bs-ATLAS-seq), as well as ESR1 binding (ChIP-seq), at the 5’ junction (−1 to +0.5 kb) of L1HS and L1PA2 elements in MCF-7 cells. Loci are sorted by increasing levels of L1 methylation. ChIP-seq signal represents the number of normalized reads per 10-bp bin. (H) Genome browser view of the BCAS3 locus integrating L1 methylation (bs-ATLAS-seq), expression (poly(A) + RNA-seq), ESR1 binding, as well as H3K4me3 and H3K27ac histone modifications (ChIP-seq). Note the distinctive spliced RNA-seq reads, antisense relative to the L1 element, linking L1 antisense promoter with the adjacent BCAS3 exon. (I) SiRNA-mediated knock-down of ESR1 leads to reduced L1 chimeric transcripts. Top, schematic representation of chimeric transcripts initiated from L1 antisense promoter and leading to truncated or alternative isoforms of the surrounding gene. Upon siRNA-mediated knock down (siESR1), the number of L1 chimeric splice junctions is expected to decrease if ESR1 drives chimeric transcript synthesis, as compared to a scrambled siRNA control (siScr). Bottom left, chimeric transcripts at the BCAS3 locus quantified by the number of normalized spliced-RNA-seq reads (RPM) detected in MCF-7 cells treated by an siRNA against ESR1 (+) or a control scrambled siRNA (-) (data from GSE153250). Bars represent the mean ± s.d. (n=6) and are overlaid by data of individual replicates (one-sided two-sample Wilcoxon test). Bottom right, average chimeric transcripts quantified as the normalized number of splice junctions between L1 and its closest gene in RPM for 42 loci (n=6, mean ± s.d.). The 42 loci are sorted by descending order according to the difference of chimeric transcript levels between cells treated by siESR1 and the control siScr. For 37 loci out of 42 (88%), L1 chimeric transcription is reduced upon ESR1 knock down. The difference is statistically significant for 5 loci (one-sided two-sample Wilcoxon test). In panels (E) and (F), boxplots represent the median and interquartile range (IQR) ± 1.5 * IQR (whiskers). Outliers beyond the end of the whiskers are plotted individually. *p < 0.05, **p < 0.01, ***p < 0.001, and ****p < 0.0001, two-sided two-sample Wilcoxon test. See also .

Journal: bioRxiv

Article Title: Resolving the heterogeneity of L1 DNA methylation reveals the epigenetic and transcriptional interplay between L1s and their integration sites

doi: 10.1101/2023.01.03.522582

Figure Lengend Snippet: (A) Screening strategy to identify TFs differentially associated between unmethylated and methylated L1HS and L1PA2 copies using curated datasets publicly available in the UniBind database . Note that for each cell line in our panel, we compared each pair of methylated and unmethylated L1 subsets to all ChIP-seq data stored in Unibind (∼3500 datasets), irrespective of the cell-type or conditions in which they were obtained. The rationale was that even if our specific cell line is not necessarily represented in Unibind datasets, a similar cell type may be represented. The main hits were then subsequently confirmed using matched datasets (see panels E and F). (B) Heatmap showing the TF binding enrichment at hypomethylated L1HS and L1PA2 in our panel of cell types. Only the 15 most enriched TFs are shown. (C) Schematic representation of the location of the motifs corresponding to the TFs identified in (B). For TFs binding upstream of L1 insertions, the number of loci with an upstream peak is indicated. (D) Heatmap displaying L1 methylation (bs-ATLAS-seq), as well as YY1 and H3K4me3 binding (ChIP-seq), at the 5’ junction (−1 to +0.5 kb) of L1HS and L1PA2 elements in 2102Ep cells. Loci are sorted by increasing levels of L1 methylation. ChIP-seq signal represents the number of normalized reads per 10-bp bin. (E) DNA methylation level of L1HS bound (+) or unbound (-) by YY1 in embryonal cell lines (H1 and 2102Ep) and other cell lines for which matched YY1 ChIP-seq were also publicly available (K562, HCT116, HepG2, HEK-293T). The number of L1HS copies in each subset (n) is indicated at the bottom of the plot. In H1 cells, the four hypomethylated loci in blue refer to those studied in . (F) DNA methylation levels of L1HS and L1PA2 loci bound (+) or not bound (-) by ESR1, FOXA1, KLF1, KLF5, Myc and EGFR2 in the relevant cell types. ChIP-seq data are matched to the cell line. The number of L1HS copies in each subset (n) is indicated at the bottom of the plot. (G) Heatmap displaying L1 methylation (bs-ATLAS-seq), as well as ESR1 binding (ChIP-seq), at the 5’ junction (−1 to +0.5 kb) of L1HS and L1PA2 elements in MCF-7 cells. Loci are sorted by increasing levels of L1 methylation. ChIP-seq signal represents the number of normalized reads per 10-bp bin. (H) Genome browser view of the BCAS3 locus integrating L1 methylation (bs-ATLAS-seq), expression (poly(A) + RNA-seq), ESR1 binding, as well as H3K4me3 and H3K27ac histone modifications (ChIP-seq). Note the distinctive spliced RNA-seq reads, antisense relative to the L1 element, linking L1 antisense promoter with the adjacent BCAS3 exon. (I) SiRNA-mediated knock-down of ESR1 leads to reduced L1 chimeric transcripts. Top, schematic representation of chimeric transcripts initiated from L1 antisense promoter and leading to truncated or alternative isoforms of the surrounding gene. Upon siRNA-mediated knock down (siESR1), the number of L1 chimeric splice junctions is expected to decrease if ESR1 drives chimeric transcript synthesis, as compared to a scrambled siRNA control (siScr). Bottom left, chimeric transcripts at the BCAS3 locus quantified by the number of normalized spliced-RNA-seq reads (RPM) detected in MCF-7 cells treated by an siRNA against ESR1 (+) or a control scrambled siRNA (-) (data from GSE153250). Bars represent the mean ± s.d. (n=6) and are overlaid by data of individual replicates (one-sided two-sample Wilcoxon test). Bottom right, average chimeric transcripts quantified as the normalized number of splice junctions between L1 and its closest gene in RPM for 42 loci (n=6, mean ± s.d.). The 42 loci are sorted by descending order according to the difference of chimeric transcript levels between cells treated by siESR1 and the control siScr. For 37 loci out of 42 (88%), L1 chimeric transcription is reduced upon ESR1 knock down. The difference is statistically significant for 5 loci (one-sided two-sample Wilcoxon test). In panels (E) and (F), boxplots represent the median and interquartile range (IQR) ± 1.5 * IQR (whiskers). Outliers beyond the end of the whiskers are plotted individually. *p < 0.05, **p < 0.01, ***p < 0.001, and ****p < 0.0001, two-sided two-sample Wilcoxon test. See also .

Article Snippet: Fragmented chromatin was diluted with 9 volumes of buffer DB (50 mM Tris pH8, 200 mM NaCl, 5 mM EDTA, 0.5% NP40), and 1 μg of anti-YY1 antibody (C15410345, Diagenode) or anti-H3K4me3 antibody (ab8580, Abcam) was added to each 1 mL of chromatin and incubated overnight at 4 °C with rotation.

Techniques: Methylation, ChIP-sequencing, Binding Assay, DNA Methylation Assay, Expressing, RNA Sequencing Assay

(A) Heatmap showing the expression levels of the 15 most enriched TF identified in the screen across the panel cell lines. FOXA1 and ESR1 are more expressed in MCF-7 as compared to other cell types whereas YY1 is more ubiquitously expressed, even if it predominantly binds to L1 elements in embryonal cells (H1 and 2102Ep) (see Figure 5E and panel B). Expression level is measured as transcripts per million (TPM). (B) DNA methylation levels of L1HS and L1PA2 elements bound (+) or unbound (-) by YY1 in embryonal cell lines (H1 and 2102Ep) and other cell lines for which matched YY1 ChIP-seq were also publicly available (K562, HCT116, HepG2, HEK-293T). The number of L1HS copies in each subset (n) is indicated at the bottom of the plot. (C) DNA methylation levels of L1HS loci with (+) or without (-) YY1 binding motifs in their 5’ UTR, and actually bound (+) or not (-) by YY1 in H1 and 2102Ep cells. (D) Expression level of L1HS element bound (+) or not (-) by YY1 and associated (+) or not (-) with H3K4me3 histone modification in 2102Ep cells. Locus-level expression was estimated by L1EM. The number of L1HS copies in each subset (n) is indicated at the bottom of the plot. (E) Genome browser view of two example L1HS loci with distinct promoter DNA methylation profiles (bs-ATLAS-seq), integrated with RNA-seq and YY1 ChIP-seq data in H1 and 2102Ep. Top, locus in chromosome 18, the YY1 signal is close to the background level, the L1HS element is hypermethylated and non-expressed. Both cell lines have similar profiles. Bottom, locus in chromosome 7, a strong YY1 peak is detected in 2102Ep cells, where the L1HS is completely unmethylated and robustly expressed. In contrast, in H1 cells, the same locus does not appear bound by YY1, is hypermethylated and non-expressed. (F) Differential expression of transposable element (TE) families between MCF-7 cells treated by an siRNA against ESR1 (+) or a control scrambled siRNA (-) measured by RNA-seq using TEtranscripts (data from GSE153250). In the MA-plot, each data point represents an aggregated TE family. TE families found significantly up- or down-regulated upon ESR1 knockdown are colored in purple and green, respectively, and data points corresponding to the L1HS to L1PA8 families are labelled (of which L1HS to L1PA6 are downregulated).

Journal: bioRxiv

Article Title: Resolving the heterogeneity of L1 DNA methylation reveals the epigenetic and transcriptional interplay between L1s and their integration sites

doi: 10.1101/2023.01.03.522582

Figure Lengend Snippet: (A) Heatmap showing the expression levels of the 15 most enriched TF identified in the screen across the panel cell lines. FOXA1 and ESR1 are more expressed in MCF-7 as compared to other cell types whereas YY1 is more ubiquitously expressed, even if it predominantly binds to L1 elements in embryonal cells (H1 and 2102Ep) (see Figure 5E and panel B). Expression level is measured as transcripts per million (TPM). (B) DNA methylation levels of L1HS and L1PA2 elements bound (+) or unbound (-) by YY1 in embryonal cell lines (H1 and 2102Ep) and other cell lines for which matched YY1 ChIP-seq were also publicly available (K562, HCT116, HepG2, HEK-293T). The number of L1HS copies in each subset (n) is indicated at the bottom of the plot. (C) DNA methylation levels of L1HS loci with (+) or without (-) YY1 binding motifs in their 5’ UTR, and actually bound (+) or not (-) by YY1 in H1 and 2102Ep cells. (D) Expression level of L1HS element bound (+) or not (-) by YY1 and associated (+) or not (-) with H3K4me3 histone modification in 2102Ep cells. Locus-level expression was estimated by L1EM. The number of L1HS copies in each subset (n) is indicated at the bottom of the plot. (E) Genome browser view of two example L1HS loci with distinct promoter DNA methylation profiles (bs-ATLAS-seq), integrated with RNA-seq and YY1 ChIP-seq data in H1 and 2102Ep. Top, locus in chromosome 18, the YY1 signal is close to the background level, the L1HS element is hypermethylated and non-expressed. Both cell lines have similar profiles. Bottom, locus in chromosome 7, a strong YY1 peak is detected in 2102Ep cells, where the L1HS is completely unmethylated and robustly expressed. In contrast, in H1 cells, the same locus does not appear bound by YY1, is hypermethylated and non-expressed. (F) Differential expression of transposable element (TE) families between MCF-7 cells treated by an siRNA against ESR1 (+) or a control scrambled siRNA (-) measured by RNA-seq using TEtranscripts (data from GSE153250). In the MA-plot, each data point represents an aggregated TE family. TE families found significantly up- or down-regulated upon ESR1 knockdown are colored in purple and green, respectively, and data points corresponding to the L1HS to L1PA8 families are labelled (of which L1HS to L1PA6 are downregulated).

Article Snippet: Fragmented chromatin was diluted with 9 volumes of buffer DB (50 mM Tris pH8, 200 mM NaCl, 5 mM EDTA, 0.5% NP40), and 1 μg of anti-YY1 antibody (C15410345, Diagenode) or anti-H3K4me3 antibody (ab8580, Abcam) was added to each 1 mL of chromatin and incubated overnight at 4 °C with rotation.

Techniques: Expressing, DNA Methylation Assay, ChIP-sequencing, Binding Assay, Modification, RNA Sequencing Assay

( A,B ) In vitro methylation assay was performed by mixing purified bacterially-expressed His-tagged YY1 protein with various protein lysine methyltransferases (KMTs), either full length (FL) or truncations with enzymatic domain, from bacterial cells ( A ) or HEK293T cells with over-expression ( B ) as indicated, followed by autoradiogram. Wild-type: wt; Enzymatically dead mutant: m. White arrows indicate automethylation (auto-me) of KMTs; Black arrows indicate methylation of YY1 (YY1(me)). ( C ) Schematic representation of the domain architecture of YY1 protein. Amino acid information for the three linker regions, aa321–324, 347–352 and 377–382, between Zn fingers as well as the very carboxyl-terminus was depicted. Acidic Region (light green); His-cluster (yellow); GA-rich region (light blue); GK-rich region (blue); Spacer (dark blue); Zn finger (purple); Linker region (black); The very carboxyl-terminus (red). ( D ) In vitro methylation assay was performed by mixing purified bacterially-expressed His-tagged SET7/9 protein with YY1 amino-terminus (1-266) or carboxyl-terminus (267-414), followed by autoradiogram (top panel). The expression of YY1(1-266) and YY1(267-414) was examined by coomassie blue staining (C.B.S) (bottom panel). ( E ) In vitro methylation assay was performed by mixing purified bacterially-expressed His-tagged SET7/9 with YY1(1-266) wild type (wt) or its mutant form with substitution of lysine 173 to arginine (K173R), followed by autoradiogram (top panel). The expression of YY1(1-266)(wt) and K173R was examined by C.B.S (bottom panel). ( F ) In vitro methylation assay was performed by mixing purified bacterially-expressed His-tagged SET7/9 with YY1(267-414) wild type (wt) or its mutant form with substitution of lysine 288, 305, 339, 341 or 411 to arginine (K288R, K305R, K339R, K341R or K411R), followed by autoradiogram (top panel). The expression of YY1(267-414)(wt), K288R, K305R, K339R, K341R and K411R was examined by C.B.S (bottom panel). ( G ) In vitro methylation assay was performed by mixing short peptides containing unmodified (K173 or K411) or mono-methylated K173 or K411 (K173me1 or K411me1) with or without purified bacterially-expressed SET7/9 proteins. Increased amount of each reaction was taken for dot blot as indicated, followed by autoradiogram.

Journal: Scientific Reports

Article Title: Regulation of Transcription Factor Yin Yang 1 by SET7/9-mediated Lysine Methylation

doi: 10.1038/srep21718

Figure Lengend Snippet: ( A,B ) In vitro methylation assay was performed by mixing purified bacterially-expressed His-tagged YY1 protein with various protein lysine methyltransferases (KMTs), either full length (FL) or truncations with enzymatic domain, from bacterial cells ( A ) or HEK293T cells with over-expression ( B ) as indicated, followed by autoradiogram. Wild-type: wt; Enzymatically dead mutant: m. White arrows indicate automethylation (auto-me) of KMTs; Black arrows indicate methylation of YY1 (YY1(me)). ( C ) Schematic representation of the domain architecture of YY1 protein. Amino acid information for the three linker regions, aa321–324, 347–352 and 377–382, between Zn fingers as well as the very carboxyl-terminus was depicted. Acidic Region (light green); His-cluster (yellow); GA-rich region (light blue); GK-rich region (blue); Spacer (dark blue); Zn finger (purple); Linker region (black); The very carboxyl-terminus (red). ( D ) In vitro methylation assay was performed by mixing purified bacterially-expressed His-tagged SET7/9 protein with YY1 amino-terminus (1-266) or carboxyl-terminus (267-414), followed by autoradiogram (top panel). The expression of YY1(1-266) and YY1(267-414) was examined by coomassie blue staining (C.B.S) (bottom panel). ( E ) In vitro methylation assay was performed by mixing purified bacterially-expressed His-tagged SET7/9 with YY1(1-266) wild type (wt) or its mutant form with substitution of lysine 173 to arginine (K173R), followed by autoradiogram (top panel). The expression of YY1(1-266)(wt) and K173R was examined by C.B.S (bottom panel). ( F ) In vitro methylation assay was performed by mixing purified bacterially-expressed His-tagged SET7/9 with YY1(267-414) wild type (wt) or its mutant form with substitution of lysine 288, 305, 339, 341 or 411 to arginine (K288R, K305R, K339R, K341R or K411R), followed by autoradiogram (top panel). The expression of YY1(267-414)(wt), K288R, K305R, K339R, K341R and K411R was examined by C.B.S (bottom panel). ( G ) In vitro methylation assay was performed by mixing short peptides containing unmodified (K173 or K411) or mono-methylated K173 or K411 (K173me1 or K411me1) with or without purified bacterially-expressed SET7/9 proteins. Increased amount of each reaction was taken for dot blot as indicated, followed by autoradiogram.

Article Snippet: Anti-YY1 K173me1 and anti-YY1 K411me1 antibodies were generated by GenScript, Inc. Antigen (peptide sequence) used for generating anti-YY1 K173me1 and anti-YY1 K411me1 was CSGGGRVK(me1)KGGGKKS and CKSHILTHAKAK(me1)NNQ, respectively; anti-Flag (F1804) antibody was purchased from Sigma; anti-SET7/9 (07–314) was purchased from Upstate; anti-LSD1/AOF2 (A300-215A) was purchased from Bethyl Laboratory, Inc; anti-YY1(H-10) (SC-7341) and anti-GAPDH (SC-25778) was purchased from Santa Cruz Biotechnology.

Techniques: In Vitro, Methylation, Purification, Over Expression, Mutagenesis, Expressing, Staining, Dot Blot

( A,B ) Increased amount of short peptides containing unmodified (K173 or K411) or mono-methylated K173 or K411 (K173me1 or K411me1) were prepared for dot blot assay, followed by immunoblotting (IB) using anti-YY1K173me1 ( A ) or anti-YY1K411me1 ( B ) antibody as indicated. ( C ) HEK293T cells transfected with control vector or vectors expressing Flag-tagged wild type (wt) or mutant YY1 (K173R or K411R) were subjected to IB with anti-YY1K173me1, anti-YY1K411me1 or anti-Flag antibody as indicated. ( D ) HeLa cells transfected with control vector or vector expressing Flag-tagged YY1 in the presence or absence of SET7/9, LSD1 wild type (wt) or enzymatically dead mutant (m) were subjected to IB with anti-YY1K173me1, anti-YY1K411me1, anti-Flag, anti-SET7/9 and anti-LSD1 antibody as indicated. ( E ) Wild type or SET7/9 knock-out (KO) HeLa cells were transfected with Flag-tagged YY1 followed by immunoblotting (IB) with antibodies as indicated.

Journal: Scientific Reports

Article Title: Regulation of Transcription Factor Yin Yang 1 by SET7/9-mediated Lysine Methylation

doi: 10.1038/srep21718

Figure Lengend Snippet: ( A,B ) Increased amount of short peptides containing unmodified (K173 or K411) or mono-methylated K173 or K411 (K173me1 or K411me1) were prepared for dot blot assay, followed by immunoblotting (IB) using anti-YY1K173me1 ( A ) or anti-YY1K411me1 ( B ) antibody as indicated. ( C ) HEK293T cells transfected with control vector or vectors expressing Flag-tagged wild type (wt) or mutant YY1 (K173R or K411R) were subjected to IB with anti-YY1K173me1, anti-YY1K411me1 or anti-Flag antibody as indicated. ( D ) HeLa cells transfected with control vector or vector expressing Flag-tagged YY1 in the presence or absence of SET7/9, LSD1 wild type (wt) or enzymatically dead mutant (m) were subjected to IB with anti-YY1K173me1, anti-YY1K411me1, anti-Flag, anti-SET7/9 and anti-LSD1 antibody as indicated. ( E ) Wild type or SET7/9 knock-out (KO) HeLa cells were transfected with Flag-tagged YY1 followed by immunoblotting (IB) with antibodies as indicated.

Article Snippet: Anti-YY1 K173me1 and anti-YY1 K411me1 antibodies were generated by GenScript, Inc. Antigen (peptide sequence) used for generating anti-YY1 K173me1 and anti-YY1 K411me1 was CSGGGRVK(me1)KGGGKKS and CKSHILTHAKAK(me1)NNQ, respectively; anti-Flag (F1804) antibody was purchased from Sigma; anti-SET7/9 (07–314) was purchased from Upstate; anti-LSD1/AOF2 (A300-215A) was purchased from Bethyl Laboratory, Inc; anti-YY1(H-10) (SC-7341) and anti-GAPDH (SC-25778) was purchased from Santa Cruz Biotechnology.

Techniques: Methylation, Dot Blot, Western Blot, Transfection, Control, Plasmid Preparation, Expressing, Mutagenesis, Knock-Out

( A ) DNA EMSA assay was performed by incubating biotinylated oligonucleotide containing YY1 consensus binding site (wt) (top panel) or its mutant form (m) (middle panel) with or without whole cell lysates prepared from HEK293T cells transfected with control vector or vectors expressing Flag-tagged YY1(wt), YY1(K173R), YY1(K174R), YY1(K409R) or YY1(K411R). Unlabeled oligonucleotide was included as indicated to demonstrate the specificity of YY1 binding with its consensus binding site. The binding affinity (gel intensity) was quantified by using Image J, with the ratio of lane 3:4:5:6:7:8 being 1:0.15:0.94:0.62:0.85:0.2. The expression of YY1(wt), YY1(K173R), YY1(K174R), YY1(K409R) and YY1(K411R) was examined through IB with anti-Flag antibody. ( B ) YY1 consensus binding site or its mutant form was cloned into pGL2-luciferase vector (pGL2-YY1(wt)- luc or pGL2-YY1(m)- luc ). YY1 binding to the consensus binding site or its mutant form can be examined through ChIP using a primer set specifically targeting to upstream (P1) or downstream (P2) of multiple cloning site in pGL2 vector. ( C ) HeLa cells were transfected with pGL2-YY1(wt)- luc or pGL2-YY1(m)- luc vector in the presence or absence of vectors expressing Flag-tagged YY1(wt), YY1(K173R) or YY1(K411R), followed by ChIP with anti-Flag antibody and then q-PCR with the primer set (P1 + P2) as described in ( B ). ChIP signals were presented as percentage of inputs (±s.e.m., **P < 0.01). Experiments were repeated three times and representative data was shown. ( D ) HeLa cells were transfected with pGL2-YY1(wt)- luc vector together with or without Flag-tagged YY1(wt), YY1(K173R) or YY1(K411R) in the presence or absence of SET7/9, followed by ChIP with anti-Flag antibody and q-PCR with the primer set (P1 + P2) as described in (B). ChIP signals were presented as percentage of inputs (±s.e.m., *P < 0.05, **P < 0.01, ***P < 0.001). Experiments were repeated three times and representative data was shown.

Journal: Scientific Reports

Article Title: Regulation of Transcription Factor Yin Yang 1 by SET7/9-mediated Lysine Methylation

doi: 10.1038/srep21718

Figure Lengend Snippet: ( A ) DNA EMSA assay was performed by incubating biotinylated oligonucleotide containing YY1 consensus binding site (wt) (top panel) or its mutant form (m) (middle panel) with or without whole cell lysates prepared from HEK293T cells transfected with control vector or vectors expressing Flag-tagged YY1(wt), YY1(K173R), YY1(K174R), YY1(K409R) or YY1(K411R). Unlabeled oligonucleotide was included as indicated to demonstrate the specificity of YY1 binding with its consensus binding site. The binding affinity (gel intensity) was quantified by using Image J, with the ratio of lane 3:4:5:6:7:8 being 1:0.15:0.94:0.62:0.85:0.2. The expression of YY1(wt), YY1(K173R), YY1(K174R), YY1(K409R) and YY1(K411R) was examined through IB with anti-Flag antibody. ( B ) YY1 consensus binding site or its mutant form was cloned into pGL2-luciferase vector (pGL2-YY1(wt)- luc or pGL2-YY1(m)- luc ). YY1 binding to the consensus binding site or its mutant form can be examined through ChIP using a primer set specifically targeting to upstream (P1) or downstream (P2) of multiple cloning site in pGL2 vector. ( C ) HeLa cells were transfected with pGL2-YY1(wt)- luc or pGL2-YY1(m)- luc vector in the presence or absence of vectors expressing Flag-tagged YY1(wt), YY1(K173R) or YY1(K411R), followed by ChIP with anti-Flag antibody and then q-PCR with the primer set (P1 + P2) as described in ( B ). ChIP signals were presented as percentage of inputs (±s.e.m., **P < 0.01). Experiments were repeated three times and representative data was shown. ( D ) HeLa cells were transfected with pGL2-YY1(wt)- luc vector together with or without Flag-tagged YY1(wt), YY1(K173R) or YY1(K411R) in the presence or absence of SET7/9, followed by ChIP with anti-Flag antibody and q-PCR with the primer set (P1 + P2) as described in (B). ChIP signals were presented as percentage of inputs (±s.e.m., *P < 0.05, **P < 0.01, ***P < 0.001). Experiments were repeated three times and representative data was shown.

Article Snippet: Anti-YY1 K173me1 and anti-YY1 K411me1 antibodies were generated by GenScript, Inc. Antigen (peptide sequence) used for generating anti-YY1 K173me1 and anti-YY1 K411me1 was CSGGGRVK(me1)KGGGKKS and CKSHILTHAKAK(me1)NNQ, respectively; anti-Flag (F1804) antibody was purchased from Sigma; anti-SET7/9 (07–314) was purchased from Upstate; anti-LSD1/AOF2 (A300-215A) was purchased from Bethyl Laboratory, Inc; anti-YY1(H-10) (SC-7341) and anti-GAPDH (SC-25778) was purchased from Santa Cruz Biotechnology.

Techniques: Binding Assay, Mutagenesis, Transfection, Control, Plasmid Preparation, Expressing, Clone Assay, Luciferase, Cloning

( A,B ) Genomic distribution of YY1 binding sites. ChIP-seq was performed in HeLa cells using anti-YY1 antibody, followed by peak finding ( A ) and motif analysis ( B ) using HOMER. ( C ) YY1 binding detected by ChIP-seq was shown for p53 , RAD1 and ABL1 genes, as indicated. ( D ) HeLa cells were transfected with control vector or vector expressing SET7/9, followed by ChIP with anti-YY1 antibody and q-PCR with primers specifically targeting promoter regions of selected genes as indicated. ChIP signals were presented as percentage of inputs (±s.e.m., **P < 0.01, ***P < 0.001). Experiments were repeated three times and representative data was shown. ( E ) HeLa cells were transfected with vectors expressing Flag-tagged YY1(wt), YY1(K173R) or YY1(K411R), followed by ChIP with anti-Flag antibody and q-PCR with primers specifically targeting promoter regions of selected genes as indicated. ChIP signals were presented as percentage of inputs (±s.e.m., **P < 0.01, ***P < 0.001). Experiments were repeated three times and representative data was shown. ( F ) HeLa cells stably expressing Flag-tagged YY1(wt) or YY1(K173R) were subjected to affinity purification with Flag M2 agarose. The resultant proteins were separated by SDS-PAGE gel, followed by silver staining. Four bands (1–4) specifically present in YY1(wt) sample were cut and subjected to mass spectrometry (MS) analysis.

Journal: Scientific Reports

Article Title: Regulation of Transcription Factor Yin Yang 1 by SET7/9-mediated Lysine Methylation

doi: 10.1038/srep21718

Figure Lengend Snippet: ( A,B ) Genomic distribution of YY1 binding sites. ChIP-seq was performed in HeLa cells using anti-YY1 antibody, followed by peak finding ( A ) and motif analysis ( B ) using HOMER. ( C ) YY1 binding detected by ChIP-seq was shown for p53 , RAD1 and ABL1 genes, as indicated. ( D ) HeLa cells were transfected with control vector or vector expressing SET7/9, followed by ChIP with anti-YY1 antibody and q-PCR with primers specifically targeting promoter regions of selected genes as indicated. ChIP signals were presented as percentage of inputs (±s.e.m., **P < 0.01, ***P < 0.001). Experiments were repeated three times and representative data was shown. ( E ) HeLa cells were transfected with vectors expressing Flag-tagged YY1(wt), YY1(K173R) or YY1(K411R), followed by ChIP with anti-Flag antibody and q-PCR with primers specifically targeting promoter regions of selected genes as indicated. ChIP signals were presented as percentage of inputs (±s.e.m., **P < 0.01, ***P < 0.001). Experiments were repeated three times and representative data was shown. ( F ) HeLa cells stably expressing Flag-tagged YY1(wt) or YY1(K173R) were subjected to affinity purification with Flag M2 agarose. The resultant proteins were separated by SDS-PAGE gel, followed by silver staining. Four bands (1–4) specifically present in YY1(wt) sample were cut and subjected to mass spectrometry (MS) analysis.

Article Snippet: Anti-YY1 K173me1 and anti-YY1 K411me1 antibodies were generated by GenScript, Inc. Antigen (peptide sequence) used for generating anti-YY1 K173me1 and anti-YY1 K411me1 was CSGGGRVK(me1)KGGGKKS and CKSHILTHAKAK(me1)NNQ, respectively; anti-Flag (F1804) antibody was purchased from Sigma; anti-SET7/9 (07–314) was purchased from Upstate; anti-LSD1/AOF2 (A300-215A) was purchased from Bethyl Laboratory, Inc; anti-YY1(H-10) (SC-7341) and anti-GAPDH (SC-25778) was purchased from Santa Cruz Biotechnology.

Techniques: Binding Assay, ChIP-sequencing, Transfection, Control, Plasmid Preparation, Expressing, Stable Transfection, Affinity Purification, SDS Page, Silver Staining, Mass Spectrometry

( A ) HeLa cells were transfected with control siRNA or siRNA specifically targeting YY1 , followed by immunoblotting using antibodies as indicated to examine the knock-down efficiency of siYY1. ( B ) Gro-seq experiments were performed with nuclei collected from cells described in (A). Genes regulated by YY1 were displayed using pie chart (top, P < 0.001). Among all genes regulated by YY1, those with or without YY1 binding on promoter regions were displayed using Venn diagram (bottom two). ( C ) Gene ontology analysis was performed for genes positively-regulated by YY1 as shown in (B) using DAVID. Top ten enriched gene ontology (GO) terms were shown. ( D ) Knock-down efficiency of siSET7/9 was examined through immunoblotting using antibodies as indicated. ( E ) HeLa cells were transfected with control siRNA or siRNA specifically targeting YY1 or SET7/9, followed by RT-qPCR analysis to examine mRNA levels of selected genes as indicated. Data shown was the relative fold change compared to control samples after normalization to actin. Experiments were repeated three times and representative data was shown. ( F ) HeLa cells were transfected with control vector or vectors expressing YY1(wt), YY1(K173R) or YY1(K411R), followed by RT-qPCR analysis to examine mRNA levels of selected genes as indicated. Data shown was the relative fold change compared to control samples after normalization to actin (±s.e.m., *P < 0.05, **P < 0.01, ***P < 0.001). Experiments were repeated four times and representative data was shown.

Journal: Scientific Reports

Article Title: Regulation of Transcription Factor Yin Yang 1 by SET7/9-mediated Lysine Methylation

doi: 10.1038/srep21718

Figure Lengend Snippet: ( A ) HeLa cells were transfected with control siRNA or siRNA specifically targeting YY1 , followed by immunoblotting using antibodies as indicated to examine the knock-down efficiency of siYY1. ( B ) Gro-seq experiments were performed with nuclei collected from cells described in (A). Genes regulated by YY1 were displayed using pie chart (top, P < 0.001). Among all genes regulated by YY1, those with or without YY1 binding on promoter regions were displayed using Venn diagram (bottom two). ( C ) Gene ontology analysis was performed for genes positively-regulated by YY1 as shown in (B) using DAVID. Top ten enriched gene ontology (GO) terms were shown. ( D ) Knock-down efficiency of siSET7/9 was examined through immunoblotting using antibodies as indicated. ( E ) HeLa cells were transfected with control siRNA or siRNA specifically targeting YY1 or SET7/9, followed by RT-qPCR analysis to examine mRNA levels of selected genes as indicated. Data shown was the relative fold change compared to control samples after normalization to actin. Experiments were repeated three times and representative data was shown. ( F ) HeLa cells were transfected with control vector or vectors expressing YY1(wt), YY1(K173R) or YY1(K411R), followed by RT-qPCR analysis to examine mRNA levels of selected genes as indicated. Data shown was the relative fold change compared to control samples after normalization to actin (±s.e.m., *P < 0.05, **P < 0.01, ***P < 0.001). Experiments were repeated four times and representative data was shown.

Article Snippet: Anti-YY1 K173me1 and anti-YY1 K411me1 antibodies were generated by GenScript, Inc. Antigen (peptide sequence) used for generating anti-YY1 K173me1 and anti-YY1 K411me1 was CSGGGRVK(me1)KGGGKKS and CKSHILTHAKAK(me1)NNQ, respectively; anti-Flag (F1804) antibody was purchased from Sigma; anti-SET7/9 (07–314) was purchased from Upstate; anti-LSD1/AOF2 (A300-215A) was purchased from Bethyl Laboratory, Inc; anti-YY1(H-10) (SC-7341) and anti-GAPDH (SC-25778) was purchased from Santa Cruz Biotechnology.

Techniques: Transfection, Control, Western Blot, Knockdown, Binding Assay, Quantitative RT-PCR, Plasmid Preparation, Expressing

( A ) HeLa cells were transfected with control siRNA or siRNA specifically targeting YY1 or SET7/9 , followed by flow cytometry analysis. Percentage of cells in each cell cycle phase, G0-G1, S and G2-M, was shown as indicated (±s.e.m.). The change of percentage of cells in G0-G1 and S phases between siCTL and siYY1 were both significant (P < 0.001). Experiments were repeated three times and representative data was shown. ( B ) HeLa cells were transfected with control siRNA or siRNA specifically targeting YY1 or SET7/9 , followed by MTS assay to measure cell proliferation rate for two consecutive days. The change of absorbance between siCTL and siYY1 in both day 2 and 3 were significant (P < 0.01 and P < 0.001, respectively). Experiments were repeated three times and representative data was shown. ( C ) HeLa cells stably expressing control vector, Flag-tagged YY1(wt), YY1(K173R) or YY1(K411R) were seeded at the same density and their proliferation rate was monitored for three consecutive days by MTS assay. Significant test was performed for the change of absorbance between different conditions. In day 2: CTL vs YY1(wt) (P < 0.001), CTL vs YY1(K411R) (P < 0.001); In day 3: CTL vs YY1(wt) (P < 0.001), CTL vs YY1(K411R) (P < 0.01); In day 4: CTL vs YY1(wt) (P < 0.001), CTL vs YY1(K173R) (P < 0.01), CTL vs YY1(K411R) (P < 0.01). Experiments were repeated three times and representative data was shown. ( D ) The levels of stably expressed Flag-tagged YY1(wt), YY1(K173R) and YY1(K411R) as described in ( C ) was examined through immunoblotting using anti-YY1 antibody. Endo-YY1: endogenous YY1.

Journal: Scientific Reports

Article Title: Regulation of Transcription Factor Yin Yang 1 by SET7/9-mediated Lysine Methylation

doi: 10.1038/srep21718

Figure Lengend Snippet: ( A ) HeLa cells were transfected with control siRNA or siRNA specifically targeting YY1 or SET7/9 , followed by flow cytometry analysis. Percentage of cells in each cell cycle phase, G0-G1, S and G2-M, was shown as indicated (±s.e.m.). The change of percentage of cells in G0-G1 and S phases between siCTL and siYY1 were both significant (P < 0.001). Experiments were repeated three times and representative data was shown. ( B ) HeLa cells were transfected with control siRNA or siRNA specifically targeting YY1 or SET7/9 , followed by MTS assay to measure cell proliferation rate for two consecutive days. The change of absorbance between siCTL and siYY1 in both day 2 and 3 were significant (P < 0.01 and P < 0.001, respectively). Experiments were repeated three times and representative data was shown. ( C ) HeLa cells stably expressing control vector, Flag-tagged YY1(wt), YY1(K173R) or YY1(K411R) were seeded at the same density and their proliferation rate was monitored for three consecutive days by MTS assay. Significant test was performed for the change of absorbance between different conditions. In day 2: CTL vs YY1(wt) (P < 0.001), CTL vs YY1(K411R) (P < 0.001); In day 3: CTL vs YY1(wt) (P < 0.001), CTL vs YY1(K411R) (P < 0.01); In day 4: CTL vs YY1(wt) (P < 0.001), CTL vs YY1(K173R) (P < 0.01), CTL vs YY1(K411R) (P < 0.01). Experiments were repeated three times and representative data was shown. ( D ) The levels of stably expressed Flag-tagged YY1(wt), YY1(K173R) and YY1(K411R) as described in ( C ) was examined through immunoblotting using anti-YY1 antibody. Endo-YY1: endogenous YY1.

Article Snippet: Anti-YY1 K173me1 and anti-YY1 K411me1 antibodies were generated by GenScript, Inc. Antigen (peptide sequence) used for generating anti-YY1 K173me1 and anti-YY1 K411me1 was CSGGGRVK(me1)KGGGKKS and CKSHILTHAKAK(me1)NNQ, respectively; anti-Flag (F1804) antibody was purchased from Sigma; anti-SET7/9 (07–314) was purchased from Upstate; anti-LSD1/AOF2 (A300-215A) was purchased from Bethyl Laboratory, Inc; anti-YY1(H-10) (SC-7341) and anti-GAPDH (SC-25778) was purchased from Santa Cruz Biotechnology.

Techniques: Transfection, Control, Flow Cytometry, MTS Assay, Stable Transfection, Expressing, Plasmid Preparation, Western Blot

Apoptotic cell analysis by AO staining and TUNEL assay. Control-MO and YY1-MO (25 ng per embryo) were injected at the one-cell stage to block translation of YY1a mRNA. The embryos were fixed and observed at the different stages postfertilization (pf). The AO-stained embryos are shown in a (Control-MO; 18.5 hpf), b (YY1-MO; 18.5 hpf), c (Control-MO; 18.5 hpf; enlarged from A), and d (YY1-MO; 18.5 hpf; enlarged from B; strongly AO-positive cells indicated by arrows). TUNEL stained embryos (all at 18.5 hpf) are shown in e (Control-MO) and f (YY1-MO group). Identification of apoptotic cell death-related gene P53 at 18.5 hpf by qRT-PCR approach as a control is shown in ( g ). All data were analyzed using either paired or unpaired Student’s t-tests as appropriate. * P < 0.01. The TUNEL-positive cells under the fluorescence microscope are considered apoptotic. Bars indicate 100 μm

Journal: Journal of Biomedical Science

Article Title: Knockdown of zebrafish YY1a can downregulate the phosphatidylserine (PS) receptor expression, leading to induce the abnormal brain and heart development

doi: 10.1186/s12929-016-0248-1

Figure Lengend Snippet: Apoptotic cell analysis by AO staining and TUNEL assay. Control-MO and YY1-MO (25 ng per embryo) were injected at the one-cell stage to block translation of YY1a mRNA. The embryos were fixed and observed at the different stages postfertilization (pf). The AO-stained embryos are shown in a (Control-MO; 18.5 hpf), b (YY1-MO; 18.5 hpf), c (Control-MO; 18.5 hpf; enlarged from A), and d (YY1-MO; 18.5 hpf; enlarged from B; strongly AO-positive cells indicated by arrows). TUNEL stained embryos (all at 18.5 hpf) are shown in e (Control-MO) and f (YY1-MO group). Identification of apoptotic cell death-related gene P53 at 18.5 hpf by qRT-PCR approach as a control is shown in ( g ). All data were analyzed using either paired or unpaired Student’s t-tests as appropriate. * P < 0.01. The TUNEL-positive cells under the fluorescence microscope are considered apoptotic. Bars indicate 100 μm

Article Snippet: Standard western-blot analysis was conducted using human anti-YY1 Mab (Cascade Bioscience, Winchester, MA), anti-zebrafish PSR N-terminus polyAb (self-made), and mouse anti-actin Mab (Chemicon, Temecula, CA).

Techniques: Cell Analysis, Staining, TUNEL Assay, Control, Injection, Blocking Assay, Quantitative RT-PCR, Fluorescence, Microscopy

Morpholino-induced knockdown of YY1a prevents cell corpse engulfment and cell migration. a Control-MO-injected embryos, lateral view of a Control-MO-injected embryo about entering into 70 % epiboly stage at 8 hpf (indicated by arrows) reveals the normally developed. b Lateral view of a YY1-MO-injected embryo reveals the delay epiboly about 20 % (indicated by red arrows). Bars indicate 100 μm. c Quantification of the delay epiboly embryos from control-MO and YY1-MO injection groups is shown the delay epiboly migration ( N = 60)

Journal: Journal of Biomedical Science

Article Title: Knockdown of zebrafish YY1a can downregulate the phosphatidylserine (PS) receptor expression, leading to induce the abnormal brain and heart development

doi: 10.1186/s12929-016-0248-1

Figure Lengend Snippet: Morpholino-induced knockdown of YY1a prevents cell corpse engulfment and cell migration. a Control-MO-injected embryos, lateral view of a Control-MO-injected embryo about entering into 70 % epiboly stage at 8 hpf (indicated by arrows) reveals the normally developed. b Lateral view of a YY1-MO-injected embryo reveals the delay epiboly about 20 % (indicated by red arrows). Bars indicate 100 μm. c Quantification of the delay epiboly embryos from control-MO and YY1-MO injection groups is shown the delay epiboly migration ( N = 60)

Article Snippet: Standard western-blot analysis was conducted using human anti-YY1 Mab (Cascade Bioscience, Winchester, MA), anti-zebrafish PSR N-terminus polyAb (self-made), and mouse anti-actin Mab (Chemicon, Temecula, CA).

Techniques: Knockdown, Migration, Control, Injection

Ubiquitous YY1a inhibition by injection of morpholinos (YY1-MO). a Western-blot analysis of YY1a proteins in the 24-h stage wild type embryos and YY1-MO-injected embryos. The knockdown of YY1a gene in these embryos by YY1-MO injection was shown in panel a , lane 3 (panel a , lanes 1–3; panel b , the positive control, HeLa cell lysate). Actin was the loading control. b Each one-cell stage embryo was injected with either 25 ng of control-MO or 25 ng of YY1-MO. At 12, 24, and 48 hpf, embryos were fixed and examined after in-situ hybridization. The phase-contrast images of the wild type (panels, a , d , and g ) and control-MO-injected (panels b , e , and h ) embryos show normal development and YY1a expression patterns. However those of the YY1-MO-injected embryos show abnormal development (panels c , f and i ) and delayed YY1a expression (panel c , 12 hpf; arrows) and abnormal YY1a expression (panel f and i ; 24 and 48 hpf, respectively; arrows). c Phase-contrast images of wild type embryos (panel a ), control-MO-injected embryos (panel b ), YY1-MO-injected embryos that are slightly affected (panel c ), and YY1-MO injected embryos that are severely affected (panel c ). The abnormal brain and heart are indicated by arrows. Bars indicate 250 μm

Journal: Journal of Biomedical Science

Article Title: Knockdown of zebrafish YY1a can downregulate the phosphatidylserine (PS) receptor expression, leading to induce the abnormal brain and heart development

doi: 10.1186/s12929-016-0248-1

Figure Lengend Snippet: Ubiquitous YY1a inhibition by injection of morpholinos (YY1-MO). a Western-blot analysis of YY1a proteins in the 24-h stage wild type embryos and YY1-MO-injected embryos. The knockdown of YY1a gene in these embryos by YY1-MO injection was shown in panel a , lane 3 (panel a , lanes 1–3; panel b , the positive control, HeLa cell lysate). Actin was the loading control. b Each one-cell stage embryo was injected with either 25 ng of control-MO or 25 ng of YY1-MO. At 12, 24, and 48 hpf, embryos were fixed and examined after in-situ hybridization. The phase-contrast images of the wild type (panels, a , d , and g ) and control-MO-injected (panels b , e , and h ) embryos show normal development and YY1a expression patterns. However those of the YY1-MO-injected embryos show abnormal development (panels c , f and i ) and delayed YY1a expression (panel c , 12 hpf; arrows) and abnormal YY1a expression (panel f and i ; 24 and 48 hpf, respectively; arrows). c Phase-contrast images of wild type embryos (panel a ), control-MO-injected embryos (panel b ), YY1-MO-injected embryos that are slightly affected (panel c ), and YY1-MO injected embryos that are severely affected (panel c ). The abnormal brain and heart are indicated by arrows. Bars indicate 250 μm

Article Snippet: Standard western-blot analysis was conducted using human anti-YY1 Mab (Cascade Bioscience, Winchester, MA), anti-zebrafish PSR N-terminus polyAb (self-made), and mouse anti-actin Mab (Chemicon, Temecula, CA).

Techniques: Inhibition, Injection, Western Blot, Knockdown, Positive Control, Control, In Situ Hybridization, Expressing

Percentage of morphant phenotypes during knockdown of YY1a by  YY1-morpholines

Journal: Journal of Biomedical Science

Article Title: Knockdown of zebrafish YY1a can downregulate the phosphatidylserine (PS) receptor expression, leading to induce the abnormal brain and heart development

doi: 10.1186/s12929-016-0248-1

Figure Lengend Snippet: Percentage of morphant phenotypes during knockdown of YY1a by YY1-morpholines

Article Snippet: Standard western-blot analysis was conducted using human anti-YY1 Mab (Cascade Bioscience, Winchester, MA), anti-zebrafish PSR N-terminus polyAb (self-made), and mouse anti-actin Mab (Chemicon, Temecula, CA).

Techniques: Knockdown, Control

Morpholino-induced knockdown of YY1a results in down-regulation of PS receptor at 24 hpf. a Western-blot analysis of PSR proteins in lysates of YY1-MO-injected embryos. Note that PSR protein level in these embryos decreases in a YY1-MO dose-dependent manner (Fig. 5a, panel a , lane 1 [control-MO, 50 ng]; lane 2 [YY1-MO, 25 ng], and lane 3 [YY1-MO, 50 ng]). Panel b shows the actin loading control. b One-cell stage embryos were each injected with either 25 ng of control-MO or 25 ng of YY1-MO. At 12, 24, and 48 hpf, embryos were fixed and in-situ hybridization was performed as described in the Methods section. Phase-contrast images show normal development and psr expression patterns in wild type (panels a , d , and g ) and control-MO-injected (panels b , e , and h ) embryos but abnormal development (panels c , f , and i ) and either a mild (panel c , 12 hpf) or severe (panel f, 24 hpf; panel i, 48 hpf) delay in psr expression (arrows) in YY1-MO-injected embryos. Bars indicate 100 μm

Journal: Journal of Biomedical Science

Article Title: Knockdown of zebrafish YY1a can downregulate the phosphatidylserine (PS) receptor expression, leading to induce the abnormal brain and heart development

doi: 10.1186/s12929-016-0248-1

Figure Lengend Snippet: Morpholino-induced knockdown of YY1a results in down-regulation of PS receptor at 24 hpf. a Western-blot analysis of PSR proteins in lysates of YY1-MO-injected embryos. Note that PSR protein level in these embryos decreases in a YY1-MO dose-dependent manner (Fig. 5a, panel a , lane 1 [control-MO, 50 ng]; lane 2 [YY1-MO, 25 ng], and lane 3 [YY1-MO, 50 ng]). Panel b shows the actin loading control. b One-cell stage embryos were each injected with either 25 ng of control-MO or 25 ng of YY1-MO. At 12, 24, and 48 hpf, embryos were fixed and in-situ hybridization was performed as described in the Methods section. Phase-contrast images show normal development and psr expression patterns in wild type (panels a , d , and g ) and control-MO-injected (panels b , e , and h ) embryos but abnormal development (panels c , f , and i ) and either a mild (panel c , 12 hpf) or severe (panel f, 24 hpf; panel i, 48 hpf) delay in psr expression (arrows) in YY1-MO-injected embryos. Bars indicate 100 μm

Article Snippet: Standard western-blot analysis was conducted using human anti-YY1 Mab (Cascade Bioscience, Winchester, MA), anti-zebrafish PSR N-terminus polyAb (self-made), and mouse anti-actin Mab (Chemicon, Temecula, CA).

Techniques: Knockdown, Western Blot, Injection, Control, In Situ Hybridization, Expressing

Morpholino-induced knockdown of YY1a results in brain and heart defects. Morphological analysis of embryos injected with either 25 ng of control-MO or YY1-MO and examined at 48 hpf or 3 dpf following staining with pax 2a , nkx 2.5 , or no stain. a Panels a – c . The embryos are stained with pax 2a ( a , b ; top view, anterior to the right) or not stained ( d – f ; lateral view). The YY1-MO-injected embryos (panel c ) has smaller brain (indicated by black arrow) and abnormal pax 2a pattern (indicated by red arrow) as compared with wild type embryos (panel a ) and control-MO-injected embryos (panel b ). The fore-, mid-, and hindbrains are shorter (indicated by open square [panel f ]; cf. with control [panels d and e ]). b Staining with nkx 2.5 was used to monitor heart development. Normal heart formation was delayed at 48 hpf (panel c ; indicated by star). Compare with the atria (A) and ventricles (V) in panels a and b . The tube-like heart in panel f (indicated by arrows) should be compared with that in wild type and control-MO-injected embryos (panels d and e , respectively) at 3 dpf. Bars indicate 100 μm

Journal: Journal of Biomedical Science

Article Title: Knockdown of zebrafish YY1a can downregulate the phosphatidylserine (PS) receptor expression, leading to induce the abnormal brain and heart development

doi: 10.1186/s12929-016-0248-1

Figure Lengend Snippet: Morpholino-induced knockdown of YY1a results in brain and heart defects. Morphological analysis of embryos injected with either 25 ng of control-MO or YY1-MO and examined at 48 hpf or 3 dpf following staining with pax 2a , nkx 2.5 , or no stain. a Panels a – c . The embryos are stained with pax 2a ( a , b ; top view, anterior to the right) or not stained ( d – f ; lateral view). The YY1-MO-injected embryos (panel c ) has smaller brain (indicated by black arrow) and abnormal pax 2a pattern (indicated by red arrow) as compared with wild type embryos (panel a ) and control-MO-injected embryos (panel b ). The fore-, mid-, and hindbrains are shorter (indicated by open square [panel f ]; cf. with control [panels d and e ]). b Staining with nkx 2.5 was used to monitor heart development. Normal heart formation was delayed at 48 hpf (panel c ; indicated by star). Compare with the atria (A) and ventricles (V) in panels a and b . The tube-like heart in panel f (indicated by arrows) should be compared with that in wild type and control-MO-injected embryos (panels d and e , respectively) at 3 dpf. Bars indicate 100 μm

Article Snippet: Standard western-blot analysis was conducted using human anti-YY1 Mab (Cascade Bioscience, Winchester, MA), anti-zebrafish PSR N-terminus polyAb (self-made), and mouse anti-actin Mab (Chemicon, Temecula, CA).

Techniques: Knockdown, Injection, Control, Staining

Injection of YY1a mRNA rescued embryos from YY1a morpholino-induced defects. YY1-MO (25 ng) and YY1a mRNA (2.5 ng) were co-injected at the one-to-two cell stage, and embryos were assessed at 48 hpf and 3 dpf. a Panel c shows YY1-MO-injected embryos with severe morphological deformities (indicated by long arrow). After rescue, the deformities were markedly reduced (panel d : indicated by short arrow; cf. wild type [panel a ] and control-MO-injected [panel b ] embryos). Bars indicate 250 μm. Whole embryos before (panel g ) and after (panel h ) rescue can be compared with wild-type (panel e ) and control-MO-injected (panel f ) embryos. Bars indicate 200 μm. b The ability of YY1a mRNA injection to rescue embryos from morphological deformities during development at 3 dpf was estimated. c Rescued embryos show normal morphology and normal YY1a expression in the brain, heart, and somites and are all stained with the YY1a probe at 3 dpf developmental stage. The normal morphology and normal YY1a pattern in the brain and heart (indicated by arrows) seen in rescued embryos (panel d ) is in contrast to the deformed brains and hearts seen in YY1-MO knockdown embryos (panel c ; indicated by arrows). The wild type (panel a ) and control-MO-injected (panel b ) are the negative controls. Bars indicate 200 μm

Journal: Journal of Biomedical Science

Article Title: Knockdown of zebrafish YY1a can downregulate the phosphatidylserine (PS) receptor expression, leading to induce the abnormal brain and heart development

doi: 10.1186/s12929-016-0248-1

Figure Lengend Snippet: Injection of YY1a mRNA rescued embryos from YY1a morpholino-induced defects. YY1-MO (25 ng) and YY1a mRNA (2.5 ng) were co-injected at the one-to-two cell stage, and embryos were assessed at 48 hpf and 3 dpf. a Panel c shows YY1-MO-injected embryos with severe morphological deformities (indicated by long arrow). After rescue, the deformities were markedly reduced (panel d : indicated by short arrow; cf. wild type [panel a ] and control-MO-injected [panel b ] embryos). Bars indicate 250 μm. Whole embryos before (panel g ) and after (panel h ) rescue can be compared with wild-type (panel e ) and control-MO-injected (panel f ) embryos. Bars indicate 200 μm. b The ability of YY1a mRNA injection to rescue embryos from morphological deformities during development at 3 dpf was estimated. c Rescued embryos show normal morphology and normal YY1a expression in the brain, heart, and somites and are all stained with the YY1a probe at 3 dpf developmental stage. The normal morphology and normal YY1a pattern in the brain and heart (indicated by arrows) seen in rescued embryos (panel d ) is in contrast to the deformed brains and hearts seen in YY1-MO knockdown embryos (panel c ; indicated by arrows). The wild type (panel a ) and control-MO-injected (panel b ) are the negative controls. Bars indicate 200 μm

Article Snippet: Standard western-blot analysis was conducted using human anti-YY1 Mab (Cascade Bioscience, Winchester, MA), anti-zebrafish PSR N-terminus polyAb (self-made), and mouse anti-actin Mab (Chemicon, Temecula, CA).

Techniques: Injection, Control, Expressing, Staining, Knockdown

Injection of PSR mRNA rescued embryos from YY1a morpholino-induced defects. YY1-MO (25 ng) and PSR mRNA (1 ng) were co-injected at the one-to-two cell stage, and embryos were assessed at 18.5 hpf, 48 hpf and 3 dpf. a Apoptotic cell analysis by TUNEL assay. Control-MO and YY1-MO (25 ng per embryo) or YY1-MO (25 ng per embryo) plus PSR mRNA (1 ng) were injected at the one-cell stage to express extra PS receptor. The embryos were fixed and observed at the different stages postfertilization (pf). TUNEL stained embryos (all at 18.5 hpf) are shown in A:a (Control-MO), A:b (YY1-MO group) and A:c (extra PSR mRNA group). The TUNEL-positive cells under the fluorescence microscope are considered apoptotic, especially in A:b (indicated by arrows). Bars indicate 100 μm. (B) Rescued embryos show normal morphology in the brain, heart, and somites. The normal morphology in the brain and heart (indicated by arrows) seen in rescued embryos (panel c , at 24 hpf; f , at 48 hpf; i , at 72 hpf) is in contrast to the deformed brains (indicated by black arrows) and hearts (indicated by red arrows) seen in YY1-MO knockdown embryos (panel b , at 24 hpf; e , at 48 hpf; h , at 72 hpf; indicated by arrows). The control-MO-injected (panel a , at 24 hpf; d , at 48 hpf; g , at 72 hpf) are the negative controls. Bars indicate 200 μm. c The ability of PSR mRNA injection to rescue embryos from morphological deformities during development at 72 hpf was estimated

Journal: Journal of Biomedical Science

Article Title: Knockdown of zebrafish YY1a can downregulate the phosphatidylserine (PS) receptor expression, leading to induce the abnormal brain and heart development

doi: 10.1186/s12929-016-0248-1

Figure Lengend Snippet: Injection of PSR mRNA rescued embryos from YY1a morpholino-induced defects. YY1-MO (25 ng) and PSR mRNA (1 ng) were co-injected at the one-to-two cell stage, and embryos were assessed at 18.5 hpf, 48 hpf and 3 dpf. a Apoptotic cell analysis by TUNEL assay. Control-MO and YY1-MO (25 ng per embryo) or YY1-MO (25 ng per embryo) plus PSR mRNA (1 ng) were injected at the one-cell stage to express extra PS receptor. The embryos were fixed and observed at the different stages postfertilization (pf). TUNEL stained embryos (all at 18.5 hpf) are shown in A:a (Control-MO), A:b (YY1-MO group) and A:c (extra PSR mRNA group). The TUNEL-positive cells under the fluorescence microscope are considered apoptotic, especially in A:b (indicated by arrows). Bars indicate 100 μm. (B) Rescued embryos show normal morphology in the brain, heart, and somites. The normal morphology in the brain and heart (indicated by arrows) seen in rescued embryos (panel c , at 24 hpf; f , at 48 hpf; i , at 72 hpf) is in contrast to the deformed brains (indicated by black arrows) and hearts (indicated by red arrows) seen in YY1-MO knockdown embryos (panel b , at 24 hpf; e , at 48 hpf; h , at 72 hpf; indicated by arrows). The control-MO-injected (panel a , at 24 hpf; d , at 48 hpf; g , at 72 hpf) are the negative controls. Bars indicate 200 μm. c The ability of PSR mRNA injection to rescue embryos from morphological deformities during development at 72 hpf was estimated

Article Snippet: Standard western-blot analysis was conducted using human anti-YY1 Mab (Cascade Bioscience, Winchester, MA), anti-zebrafish PSR N-terminus polyAb (self-made), and mouse anti-actin Mab (Chemicon, Temecula, CA).

Techniques: Injection, Cell Analysis, TUNEL Assay, Control, Staining, Fluorescence, Microscopy, Knockdown