|
EY Laboratories
malii  Malii, supplied by EY Laboratories, used in various techniques. Bioz Stars score: 90/100, based on 1 PubMed citations. ZERO BIAS - scores, article reviews, protocol conditions and more https://www.bioz.com/result/malii/product/EY Laboratories Average 90 stars, based on 1 article reviews
malii - by Bioz Stars,
2026-06
90/100 stars
|
Buy from Supplier |
|
GeneTex
malii ![(A) MFI of SNA or (B) <t>MALII</t> gated on PB-derived Lin - HLADR low CD33 + CD11b + cells from lung cancer patient and healthy controls. MFI is shown as change to FMO and was determined by flow cytometry. N=8-13 donors with at least N=2 experiments. (C) MALDI-TOF mass spectra (m/z 1200–5000) of N-glycans isolated from CD33 + cells of healthy donor and lung cancer patient derived from fresh blood. The N-glycans were released by PNGaseF and permethylated prior to MALDI-TOF-TOF profiling. Main structures are depicted above the corresponding peaks. Assignments are based on composition and knowledge of biosynthetic pathways. All molecular ions are [M + Na] + . Residues above a bracket have not had their location unequivocally defined. (D) Relative quantification of N-Glycans detected in cancer patient and healthy donor derived CD33 + cells from (C) . N=1 . (E) Fresh blood from B16F10 tumor bearing mice and naïve wildtype mice was collected at day 14 after tumor inoculation and analyzed for SNA gated on (E) CD45 + CD11b + Ly6C + or (F) CD45 + CD11b + Ly6G + cells. MFI is shown as change to FMO. 7-8 mice per group with N=2 experiments . Data are presented as mean. Error bar values represent SD. Two-tailed unpaired Student’s t test was used. *P<0.05, **P<0.01, ***P<0.001, and ****P<0.0001.](https://bio-rxiv-images-cdn.bioz.com/dois_ending_with_25/10__1101_slash_2023__06__29__547025/10__1101_slash_2023__06__29__547025___F3.large.jpg) Malii, supplied by GeneTex, used in various techniques. Bioz Stars score: 90/100, based on 1 PubMed citations. ZERO BIAS - scores, article reviews, protocol conditions and more https://www.bioz.com/result/malii/product/GeneTex Average 90 stars, based on 1 article reviews
malii - by Bioz Stars,
2026-06
90/100 stars
|
Buy from Supplier |
Image Search Results
Journal: PLoS Pathogens
Article Title: The Epstein-Barr Virus Glycoprotein gp150 Forms an Immune-Evasive Glycan Shield at the Surface of Infected Cells
doi: 10.1371/journal.ppat.1005550
Figure Lengend Snippet: A-D) CHO and Lec2 cells expressing human β 2 m, HLA I, and CD1d were lentivirally transduced to co-express gp150 or HA-gp150ΔC and GFP (from EF1a and PGK promoters, respectively). A) Lectin (WGA-FITC) binding confirmed the glycosylation defect in Lec2 cells compared to parental CHO cells. B) Migration height of HA-gp150 was visualised by Western blot analysis. C-D) Levels of HLA I and CD1d at the surface of HA-gp150ΔC + GFP + (gp150 + ) cells were compared to those on control, non-transduced GFP - (gp150 - ) cells. D) Surface levels of HLA I and CD1d are depicted as log MFI values with 95% confidence intervals, for gp150 + versus gp150 - wt CHO cells or sialylation-defective Lec2 cells. The slopes of the connecting lines (Δlog MFI) reflect the downregulation induced by gp150. Statistical analysis was performed using two-way ANOVAs and significance of the interaction term was assessed, as described in the Material and Methods section. One representative experiment of at least six is depicted. * p<0.01. E-L) MJS-CD1d-gp150 cells were generated by transduction with a lentivirus encoding both gp150 and GFP (from a CMV promoter and an IRES sequence, respectively) and were analysed 3 days post-transduction by Western blot and by flow cytometry, as for A-D with the modifications indicated below. E-H) To prevent sialylation, cells were treated with the sialic acid transferase inhibitor (500 μM inhibitor) fluorinated P-3F ax -Neu5Ac. As a control, cells were treated with the non-fluorinated compound (500 μM, ctrl) for 4 days, starting 1 day prior to transduction. This control treatment was comparable to when cells were left untreated. E) Lectins SNAI, MALII, or PNA were used to detect sialoglycans or desialylated glycans, respectively. G) gp150 + GFP high cells were compared to non-transduced cells. H) One representative experiment of two is depicted. * p<0.01. I-L) To remove surface sialylation, intact cells were treated with neuraminidase (1U/μl, 60 min, 37°C) prior to cell lysis or lectin/Ab staining. L) One representative experiment of three is depicted. * p<0.01.
Article Snippet: Optimal concentration of the fluorinated P-3F ax -Neu5Ac inhibitor was determined and effectiveness of treatment was monitored by binding of the biotinylated lectins SNAI ( Sambucus nigra ),
Techniques: Expressing, Binding Assay, Glycoproteomics, Migration, Western Blot, Control, Generated, Transduction, Sequencing, Flow Cytometry, Lysis, Staining
Journal: bioRxiv
Article Title: Engagement of sialylated glycans with Siglec receptors on myeloid suppressor cells inhibit anti-cancer immunity via CCL2
doi: 10.1101/2023.06.29.547025
Figure Lengend Snippet: (A) MFI of SNA or (B) MALII gated on PB-derived Lin - HLADR low CD33 + CD11b + cells from lung cancer patient and healthy controls. MFI is shown as change to FMO and was determined by flow cytometry. N=8-13 donors with at least N=2 experiments. (C) MALDI-TOF mass spectra (m/z 1200–5000) of N-glycans isolated from CD33 + cells of healthy donor and lung cancer patient derived from fresh blood. The N-glycans were released by PNGaseF and permethylated prior to MALDI-TOF-TOF profiling. Main structures are depicted above the corresponding peaks. Assignments are based on composition and knowledge of biosynthetic pathways. All molecular ions are [M + Na] + . Residues above a bracket have not had their location unequivocally defined. (D) Relative quantification of N-Glycans detected in cancer patient and healthy donor derived CD33 + cells from (C) . N=1 . (E) Fresh blood from B16F10 tumor bearing mice and naïve wildtype mice was collected at day 14 after tumor inoculation and analyzed for SNA gated on (E) CD45 + CD11b + Ly6C + or (F) CD45 + CD11b + Ly6G + cells. MFI is shown as change to FMO. 7-8 mice per group with N=2 experiments . Data are presented as mean. Error bar values represent SD. Two-tailed unpaired Student’s t test was used. *P<0.05, **P<0.01, ***P<0.001, and ****P<0.0001.
Article Snippet: Fluorophore-coupled lectins - PNA-PE (GeneTex) and SNA-FITC (GeneTex) - and
Techniques: Derivative Assay, Flow Cytometry, Isolation, Quantitative Proteomics, Two Tailed Test

Journal: bioRxiv
Article Title: Engagement of sialylated glycans with Siglec receptors on myeloid suppressor cells inhibit anti-cancer immunity via CCL2
doi: 10.1101/2023.06.29.547025
Figure Lengend Snippet: (A) PNA gated on PB-derived CD45 + Lin - HLADR low CD33 + CD11b + cells from primary lung cancer patient and healthy controls. MFI is shown as a change to FMO and was determined by flow. N=8-12 donors with at least N=2 . (B) Fresh blood from B16F10 tumor-bearing mice and naïve wildtype mice was collected at day 14 after tumor inoculation and analyzed for MALII or (C) PNA gated on CD45 + CD11b + Ly6C + or CD45 + CD11b + Ly6G + cells. MFI is shown as a change to FMO. 5-8 mice per group. Data are presented as mean. Error bar values represent SD. Two-tailed unpaired Student’s t test or multiple unpaired t-tests (B, C) was used. *P<0.05, **P<0.01, ***P<0.001, and ****P<0.0001.
Article Snippet: Fluorophore-coupled lectins - PNA-PE (GeneTex) and SNA-FITC (GeneTex) - and
Techniques: Derivative Assay, Two Tailed Test

Journal: bioRxiv
Article Title: Engagement of sialylated glycans with Siglec receptors on myeloid suppressor cells inhibit anti-cancer immunity via CCL2
doi: 10.1101/2023.06.29.547025
Figure Lengend Snippet: (A) Experimental setup: SigE ΔLysM and SigE WT littermates were subcutaneously injected with B16F10 or B16F10 cells expressing sialidase (B16F10-sia). Tumor growth and probability of survival were addressed as the main read-out. (B) B16F10 and B16F10-sia cells were stained for SNA, MALII and Sialidase expression to validate the successful generation of stable cell lines. Cell lines were stained before each experiment, representative results are shown. (C) Tumor volume and (D) Kaplan-Meier survival curves from pooled data from 2 independent experiments. N=8-12 mice per group from 2 experiments. Data are presented as mean with error bars presenting SEM. Tumor growth was compared by mixed-effects analysis followed by Bonferroni’s multiple comparisons test. For survival analysis, log-rank test was used followed by Šidák correction for multiple comparisons. *P<0.05, **P<0.01, ***P<0.001, and ****P<0.0001.
Article Snippet: Fluorophore-coupled lectins - PNA-PE (GeneTex) and SNA-FITC (GeneTex) - and
Techniques: Injection, Expressing, Staining, Stable Transfection
Journal: bioRxiv
Article Title: Engagement of sialylated glycans with Siglec receptors on myeloid suppressor cells inhibit anti-cancer immunity via CCL2
doi: 10.1101/2023.06.29.547025
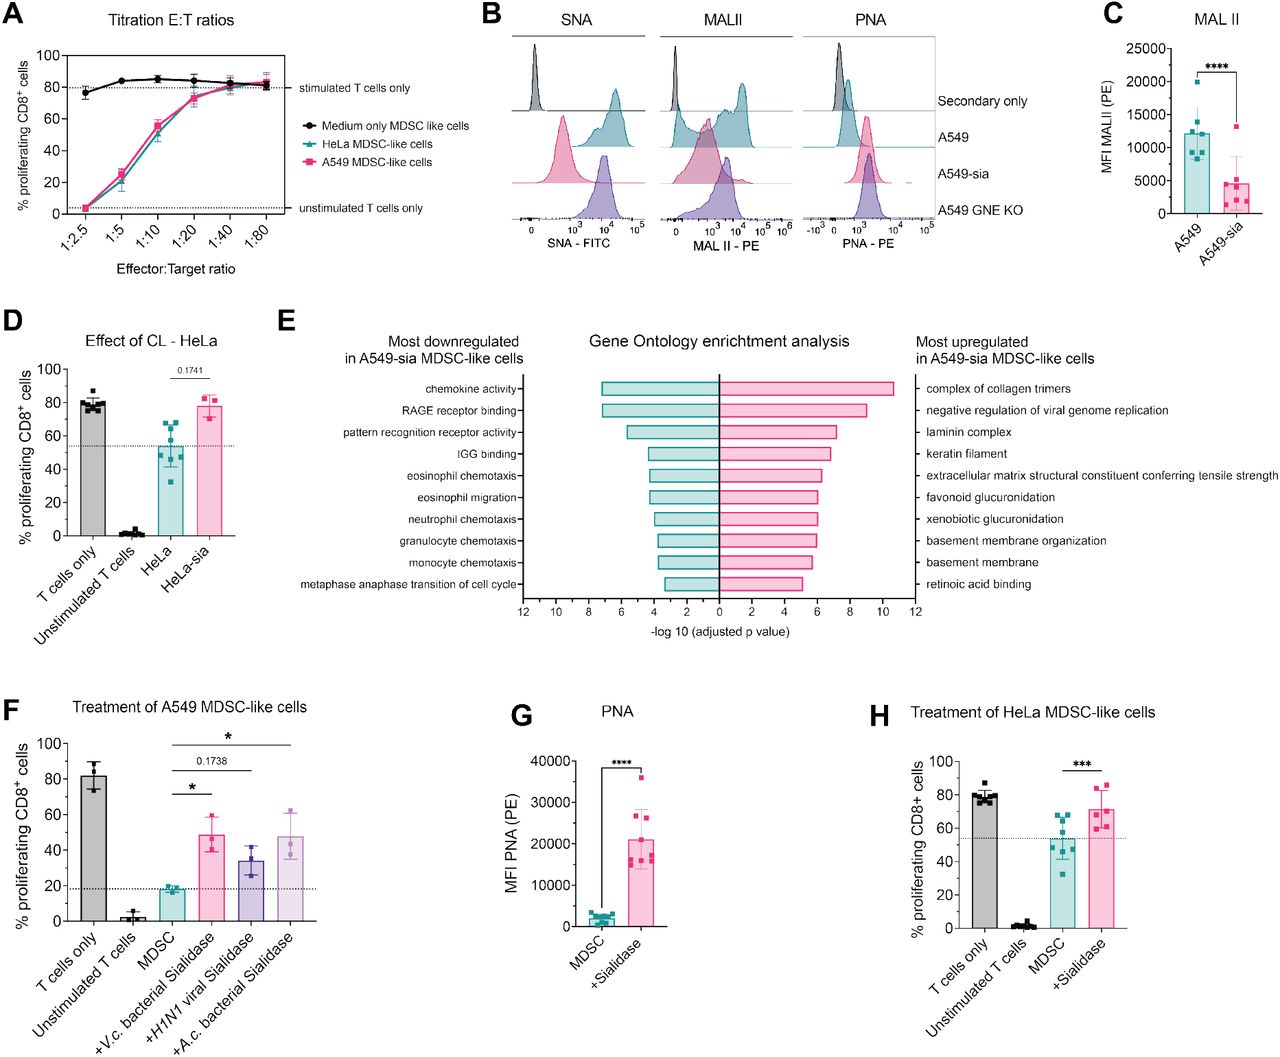
Figure Lengend Snippet: (A) Identification of E:T ratios to validate the suppressive capacity of CD33 + cells against CD8 + cells. Suppressive myeloid cells were generated by co-culture with A549 (pink), HeLa (green) or without cancer cells (black). Dotted lines indicate the proliferation of T cells alone with/without stimulation by IL-2, aCD3/28 microbeads. N=4 donors of N=2 experiments . (B) A549, A549 expressing sialidase (A549-sia) and A549 GNE KO cells were stained for SNA, MALII and PNA to validate the successful generation of stable cell lines. Cell lines were stained before each experiment, representative results are shown. (C) MALII staining was performed on suppressive CD33 + cells on day 7 of the experiment. N=7 donors of N=4 experiments. (D) Percentage of proliferating CD8 + cells upon co-culture (1:10 ratio) with indicated suppressive CD33 + cells. Suppressive myeloid cells were generated using HeLa or HeLa-expressing sialidase (HeLa-sia) cancer cell lines. N=3-8 donors (E) Gene ontology enrichment analysis of the top 10 up- and downregulated gene sets found in suppressive CD33 + cells generated with A549-sia compared to parental A549 cell line. (F) PNA staining was assessed on suppressive CD33 + cells after pretreatment with sialidase on day 7 of the experiment. N=9 donors of N=5 experiments. (G) Proliferating CD8 + cells in percentage co-cultured with suppressive CD33 + cells generated by A549 co-culture in a ratio of 1:5. CD33 + cells were used immediately or were pretreated with indicated sialidases. N=3 donors of N=2 experiments. (H) Percentage of proliferating CD8 + cells upon co-culture (1:10 ratio) with suppressive CD33 + cells generated by HeLa co-culture. CD33 + cells were used immediately or were pretreated with sialidase. Data are presented as mean and error bar values represent SD. Paired t-test was used. *P<0.05, **P<0.01, ***P<0.001, and ****P<0.0001.
Article Snippet: Fluorophore-coupled lectins - PNA-PE (GeneTex) and SNA-FITC (GeneTex) - and
Techniques: Generated, Co-Culture Assay, Expressing, Staining, Stable Transfection, Cell Culture