cd43 Search Results


95
Miltenyi Biotec anti cd43 microbeads
Anti Cd43 Microbeads, supplied by Miltenyi Biotec, used in various techniques. Bioz Stars score: 95/100, based on 1 PubMed citations. ZERO BIAS - scores, article reviews, protocol conditions and more
https://www.bioz.com/result/anti cd43 microbeads/product/Miltenyi Biotec
Average 95 stars, based on 1 article reviews
anti cd43 microbeads - by Bioz Stars, 2026-05
95/100 stars
  Buy from Supplier

cd43  (Bethyl)
92
Bethyl cd43
Cd43, supplied by Bethyl, used in various techniques. Bioz Stars score: 92/100, based on 1 PubMed citations. ZERO BIAS - scores, article reviews, protocol conditions and more
https://www.bioz.com/result/cd43/product/Bethyl
Average 92 stars, based on 1 article reviews
cd43 - by Bioz Stars, 2026-05
92/100 stars
  Buy from Supplier

90
R&D Systems mouse anti cd43 ly 48 microbeads
Mouse Anti Cd43 Ly 48 Microbeads, supplied by R&D Systems, used in various techniques. Bioz Stars score: 90/100, based on 1 PubMed citations. ZERO BIAS - scores, article reviews, protocol conditions and more
https://www.bioz.com/result/mouse anti cd43 ly 48 microbeads/product/R&D Systems
Average 90 stars, based on 1 article reviews
mouse anti cd43 ly 48 microbeads - by Bioz Stars, 2026-05
90/100 stars
  Buy from Supplier

92
Miltenyi Biotec cd43 pe
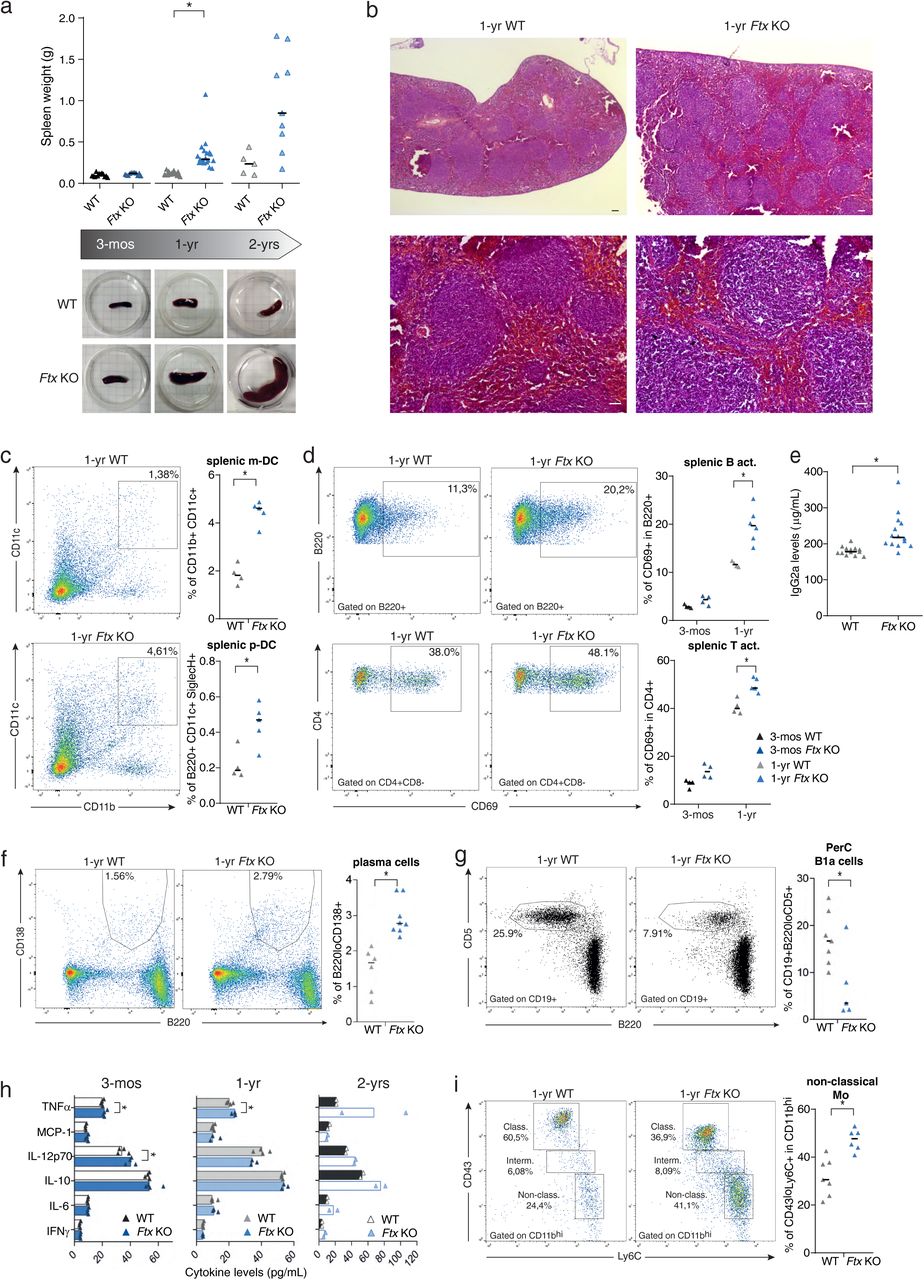
a. Spleen weight of wild-type (WT) and Ftx KO females at 3-months, 1-year and 2-years of age. Median values are shown. ( t-test , * p -values < 0.05). Underneath, representative images of WT and Ftx KO spleens from 3-month, 1-year and 2-year-old females. b. Representative images of hematoxylin-eosin staining on sections of spleens from 1-year-old WT and Ftx KO females. Scale bar; 100 μm. c. Representative flow cytometry analysis of splenic myeloid dendritic cells (m-DC) in WT and Ftx KO 1-year-old females. On the right, percentages of splenic m-DC (CD11b + CD11c + ) and splenic plasmacytoid dendritic cells (p-DC) (CD11c + B220 + SiglecH + ) in leucocytes. Each triangle represents a mouse. Median values are shown. ( t-test , * p -values < 0.05). d. Representative flow cytometry analysis of spontaneously activated B cells (B220 + CD69 + ) (upper panels) or of spontaneously activated T cells (CD4 + CD69 + ) (lower panels) in spleen from 1-year-old WT and Ftx KO females. Percentages in leucocytes are shown on the graphs beneath. Each triangle represents a mouse. Median values are shown. ( t-test , * p -values < 0.05). e. IgG2a natural antibody levels in sera of 1-year- and 2-year-old WT or Ftx KO females measured by ELISA. Each triangle represents a mouse. Median values are shown. ( t-test , * p -values < 0.05). f. Representative flow cytometry analysis of (B220 + CD138 + ) plasma cells in the spleen of 1-year-old WT and Ftx KO females. Percentages in leucocytes are shown on the graphs beneath. Each triangle represents a mouse. Median values are shown. ( t-test , * p -values < 0.05). g. Representative flow cytometry analysis of (CD19 + B220 lo CD5 + ) natural antibody producing B1a in the peritoneal cavity (PerC) of 1-year-old WT and Ftx KO females. Percentages in leucocytes are shown on the graphs beneath. Each triangle represents a mouse. Median values are shown. ( t-test , * p -values < 0.05). h. Cytokines levels in the blood analysed with CBA assays on sera from 3-month-, 1-year-, or 2-year-old WT and Ftx KO females. Each triangle represents a mouse. Median values are shown. ( t-test , * p -values < 0.05). i. Representative flow cytometry analysis of monocyte populations including non-classical (CD11b hi <t>CD43</t> lo Ly6C + ) scavenger monocytes in the spleen of 1-year-old WT and Ftx KO females. Percentages in leucocytes are shown on the graphs beneath. Each triangle represents a mouse. Median values are shown. ( t-test , * p -values < 0.05).
Cd43 Pe, supplied by Miltenyi Biotec, used in various techniques. Bioz Stars score: 92/100, based on 1 PubMed citations. ZERO BIAS - scores, article reviews, protocol conditions and more
https://www.bioz.com/result/cd43 pe/product/Miltenyi Biotec
Average 92 stars, based on 1 article reviews
cd43 pe - by Bioz Stars, 2026-05
92/100 stars
  Buy from Supplier

94
Miltenyi Biotec cd43
a. Spleen weight of wild-type (WT) and Ftx KO females at 3-months, 1-year and 2-years of age. Median values are shown. ( t-test , * p -values < 0.05). Underneath, representative images of WT and Ftx KO spleens from 3-month, 1-year and 2-year-old females. b. Representative images of hematoxylin-eosin staining on sections of spleens from 1-year-old WT and Ftx KO females. Scale bar; 100 μm. c. Representative flow cytometry analysis of splenic myeloid dendritic cells (m-DC) in WT and Ftx KO 1-year-old females. On the right, percentages of splenic m-DC (CD11b + CD11c + ) and splenic plasmacytoid dendritic cells (p-DC) (CD11c + B220 + SiglecH + ) in leucocytes. Each triangle represents a mouse. Median values are shown. ( t-test , * p -values < 0.05). d. Representative flow cytometry analysis of spontaneously activated B cells (B220 + CD69 + ) (upper panels) or of spontaneously activated T cells (CD4 + CD69 + ) (lower panels) in spleen from 1-year-old WT and Ftx KO females. Percentages in leucocytes are shown on the graphs beneath. Each triangle represents a mouse. Median values are shown. ( t-test , * p -values < 0.05). e. IgG2a natural antibody levels in sera of 1-year- and 2-year-old WT or Ftx KO females measured by ELISA. Each triangle represents a mouse. Median values are shown. ( t-test , * p -values < 0.05). f. Representative flow cytometry analysis of (B220 + CD138 + ) plasma cells in the spleen of 1-year-old WT and Ftx KO females. Percentages in leucocytes are shown on the graphs beneath. Each triangle represents a mouse. Median values are shown. ( t-test , * p -values < 0.05). g. Representative flow cytometry analysis of (CD19 + B220 lo CD5 + ) natural antibody producing B1a in the peritoneal cavity (PerC) of 1-year-old WT and Ftx KO females. Percentages in leucocytes are shown on the graphs beneath. Each triangle represents a mouse. Median values are shown. ( t-test , * p -values < 0.05). h. Cytokines levels in the blood analysed with CBA assays on sera from 3-month-, 1-year-, or 2-year-old WT and Ftx KO females. Each triangle represents a mouse. Median values are shown. ( t-test , * p -values < 0.05). i. Representative flow cytometry analysis of monocyte populations including non-classical (CD11b hi <t>CD43</t> lo Ly6C + ) scavenger monocytes in the spleen of 1-year-old WT and Ftx KO females. Percentages in leucocytes are shown on the graphs beneath. Each triangle represents a mouse. Median values are shown. ( t-test , * p -values < 0.05).
Cd43, supplied by Miltenyi Biotec, used in various techniques. Bioz Stars score: 94/100, based on 1 PubMed citations. ZERO BIAS - scores, article reviews, protocol conditions and more
https://www.bioz.com/result/cd43/product/Miltenyi Biotec
Average 94 stars, based on 1 article reviews
cd43 - by Bioz Stars, 2026-05
94/100 stars
  Buy from Supplier

93
Bio-Rad anti cd 43 antibody
a. Spleen weight of wild-type (WT) and Ftx KO females at 3-months, 1-year and 2-years of age. Median values are shown. ( t-test , * p -values < 0.05). Underneath, representative images of WT and Ftx KO spleens from 3-month, 1-year and 2-year-old females. b. Representative images of hematoxylin-eosin staining on sections of spleens from 1-year-old WT and Ftx KO females. Scale bar; 100 μm. c. Representative flow cytometry analysis of splenic myeloid dendritic cells (m-DC) in WT and Ftx KO 1-year-old females. On the right, percentages of splenic m-DC (CD11b + CD11c + ) and splenic plasmacytoid dendritic cells (p-DC) (CD11c + B220 + SiglecH + ) in leucocytes. Each triangle represents a mouse. Median values are shown. ( t-test , * p -values < 0.05). d. Representative flow cytometry analysis of spontaneously activated B cells (B220 + CD69 + ) (upper panels) or of spontaneously activated T cells (CD4 + CD69 + ) (lower panels) in spleen from 1-year-old WT and Ftx KO females. Percentages in leucocytes are shown on the graphs beneath. Each triangle represents a mouse. Median values are shown. ( t-test , * p -values < 0.05). e. IgG2a natural antibody levels in sera of 1-year- and 2-year-old WT or Ftx KO females measured by ELISA. Each triangle represents a mouse. Median values are shown. ( t-test , * p -values < 0.05). f. Representative flow cytometry analysis of (B220 + CD138 + ) plasma cells in the spleen of 1-year-old WT and Ftx KO females. Percentages in leucocytes are shown on the graphs beneath. Each triangle represents a mouse. Median values are shown. ( t-test , * p -values < 0.05). g. Representative flow cytometry analysis of (CD19 + B220 lo CD5 + ) natural antibody producing B1a in the peritoneal cavity (PerC) of 1-year-old WT and Ftx KO females. Percentages in leucocytes are shown on the graphs beneath. Each triangle represents a mouse. Median values are shown. ( t-test , * p -values < 0.05). h. Cytokines levels in the blood analysed with CBA assays on sera from 3-month-, 1-year-, or 2-year-old WT and Ftx KO females. Each triangle represents a mouse. Median values are shown. ( t-test , * p -values < 0.05). i. Representative flow cytometry analysis of monocyte populations including non-classical (CD11b hi <t>CD43</t> lo Ly6C + ) scavenger monocytes in the spleen of 1-year-old WT and Ftx KO females. Percentages in leucocytes are shown on the graphs beneath. Each triangle represents a mouse. Median values are shown. ( t-test , * p -values < 0.05).
Anti Cd 43 Antibody, supplied by Bio-Rad, used in various techniques. Bioz Stars score: 93/100, based on 1 PubMed citations. ZERO BIAS - scores, article reviews, protocol conditions and more
https://www.bioz.com/result/anti cd 43 antibody/product/Bio-Rad
Average 93 stars, based on 1 article reviews
anti cd 43 antibody - by Bioz Stars, 2026-05
93/100 stars
  Buy from Supplier

90
Elabscience Biotechnology anti cd43 primary antibodies
a. Spleen weight of wild-type (WT) and Ftx KO females at 3-months, 1-year and 2-years of age. Median values are shown. ( t-test , * p -values < 0.05). Underneath, representative images of WT and Ftx KO spleens from 3-month, 1-year and 2-year-old females. b. Representative images of hematoxylin-eosin staining on sections of spleens from 1-year-old WT and Ftx KO females. Scale bar; 100 μm. c. Representative flow cytometry analysis of splenic myeloid dendritic cells (m-DC) in WT and Ftx KO 1-year-old females. On the right, percentages of splenic m-DC (CD11b + CD11c + ) and splenic plasmacytoid dendritic cells (p-DC) (CD11c + B220 + SiglecH + ) in leucocytes. Each triangle represents a mouse. Median values are shown. ( t-test , * p -values < 0.05). d. Representative flow cytometry analysis of spontaneously activated B cells (B220 + CD69 + ) (upper panels) or of spontaneously activated T cells (CD4 + CD69 + ) (lower panels) in spleen from 1-year-old WT and Ftx KO females. Percentages in leucocytes are shown on the graphs beneath. Each triangle represents a mouse. Median values are shown. ( t-test , * p -values < 0.05). e. IgG2a natural antibody levels in sera of 1-year- and 2-year-old WT or Ftx KO females measured by ELISA. Each triangle represents a mouse. Median values are shown. ( t-test , * p -values < 0.05). f. Representative flow cytometry analysis of (B220 + CD138 + ) plasma cells in the spleen of 1-year-old WT and Ftx KO females. Percentages in leucocytes are shown on the graphs beneath. Each triangle represents a mouse. Median values are shown. ( t-test , * p -values < 0.05). g. Representative flow cytometry analysis of (CD19 + B220 lo CD5 + ) natural antibody producing B1a in the peritoneal cavity (PerC) of 1-year-old WT and Ftx KO females. Percentages in leucocytes are shown on the graphs beneath. Each triangle represents a mouse. Median values are shown. ( t-test , * p -values < 0.05). h. Cytokines levels in the blood analysed with CBA assays on sera from 3-month-, 1-year-, or 2-year-old WT and Ftx KO females. Each triangle represents a mouse. Median values are shown. ( t-test , * p -values < 0.05). i. Representative flow cytometry analysis of monocyte populations including non-classical (CD11b hi <t>CD43</t> lo Ly6C + ) scavenger monocytes in the spleen of 1-year-old WT and Ftx KO females. Percentages in leucocytes are shown on the graphs beneath. Each triangle represents a mouse. Median values are shown. ( t-test , * p -values < 0.05).
Anti Cd43 Primary Antibodies, supplied by Elabscience Biotechnology, used in various techniques. Bioz Stars score: 90/100, based on 1 PubMed citations. ZERO BIAS - scores, article reviews, protocol conditions and more
https://www.bioz.com/result/anti cd43 primary antibodies/product/Elabscience Biotechnology
Average 90 stars, based on 1 article reviews
anti cd43 primary antibodies - by Bioz Stars, 2026-05
90/100 stars
  Buy from Supplier

85
R&D Systems cd43
A) Timeline of microglial differentiation. iMGLs were generated from iPSCs following the protocol from McQuade et al., 2018. On days 36, 38, 40, and 42, iMGLs received 50ng/mL LPS or vehicle (PBS) at the time of feeding, and they were characterized on D43. B) HPCs at day 12 of differentiation from iPSCs were fluorescently labeled for <t>CD43</t> (green) and DAPI (blue) and CD43+ cells were quantified (right; N = 3-5 independent preps, unpaired t test). C) Confocal image of iMGLs immunolabeled for Iba1 with phagocytosed fluorescent latex beads (left) and quantification of the percentage of phagocytic cells obtained via flow cytometry. (right; N = 3 independent preps, Unpaired t test). D) Representative confocal images of iMGLs immunolabeled for PU.1 (red) and Iba1 (green) and stained with DAPI (white), with quantification of the percentage of PU.1- and Iba1-expressing iMGLs (right; N = 4 independent preps; Unpaired t test). E) Immunofluorescent labeling of Trem2 (red) and P2RY12 (green) in iMGLs with a 7-day treatment of either PBS or 50ng/mL LPS. F) Representative images of iMGLs with immunolabeling of PU.1 (blue) and BODIPY-493/503 labeling of LDs. LDs were quantified per cell and plotted as the fold-change relative to the average of the E3 PBS condition (N = 23-25 wells from 4 independent experiments; Two-way ANOVA with Fisher’s LSD Test). G) RT-qPCR characterization for D31 iMGLs treated with PBS or LPS. Plots show relative expression (2^ΔCt) to housekeeping gene PP1A (N = 3 independent experiments; Two-way ANOVA with Fisher’s LSD Test). All bar graphs represent the mean with error bars representing SEM. * p < 0.05, ** p < 0.01, *** p < 0.001, and **** p < 0.0001.
Cd43, supplied by R&D Systems, used in various techniques. Bioz Stars score: 85/100, based on 1 PubMed citations. ZERO BIAS - scores, article reviews, protocol conditions and more
https://www.bioz.com/result/cd43/product/R&D Systems
Average 85 stars, based on 1 article reviews
cd43 - by Bioz Stars, 2026-05
85/100 stars
  Buy from Supplier

93
Miltenyi Biotec human cd43 microbeads
A) Timeline of microglial differentiation. iMGLs were generated from iPSCs following the protocol from McQuade et al., 2018. On days 36, 38, 40, and 42, iMGLs received 50ng/mL LPS or vehicle (PBS) at the time of feeding, and they were characterized on D43. B) HPCs at day 12 of differentiation from iPSCs were fluorescently labeled for <t>CD43</t> (green) and DAPI (blue) and CD43+ cells were quantified (right; N = 3-5 independent preps, unpaired t test). C) Confocal image of iMGLs immunolabeled for Iba1 with phagocytosed fluorescent latex beads (left) and quantification of the percentage of phagocytic cells obtained via flow cytometry. (right; N = 3 independent preps, Unpaired t test). D) Representative confocal images of iMGLs immunolabeled for PU.1 (red) and Iba1 (green) and stained with DAPI (white), with quantification of the percentage of PU.1- and Iba1-expressing iMGLs (right; N = 4 independent preps; Unpaired t test). E) Immunofluorescent labeling of Trem2 (red) and P2RY12 (green) in iMGLs with a 7-day treatment of either PBS or 50ng/mL LPS. F) Representative images of iMGLs with immunolabeling of PU.1 (blue) and BODIPY-493/503 labeling of LDs. LDs were quantified per cell and plotted as the fold-change relative to the average of the E3 PBS condition (N = 23-25 wells from 4 independent experiments; Two-way ANOVA with Fisher’s LSD Test). G) RT-qPCR characterization for D31 iMGLs treated with PBS or LPS. Plots show relative expression (2^ΔCt) to housekeeping gene PP1A (N = 3 independent experiments; Two-way ANOVA with Fisher’s LSD Test). All bar graphs represent the mean with error bars representing SEM. * p < 0.05, ** p < 0.01, *** p < 0.001, and **** p < 0.0001.
Human Cd43 Microbeads, supplied by Miltenyi Biotec, used in various techniques. Bioz Stars score: 93/100, based on 1 PubMed citations. ZERO BIAS - scores, article reviews, protocol conditions and more
https://www.bioz.com/result/human cd43 microbeads/product/Miltenyi Biotec
Average 93 stars, based on 1 article reviews
human cd43 microbeads - by Bioz Stars, 2026-05
93/100 stars
  Buy from Supplier

95
Miltenyi Biotec cd43 ly 48 microbeads
A) Timeline of microglial differentiation. iMGLs were generated from iPSCs following the protocol from McQuade et al., 2018. On days 36, 38, 40, and 42, iMGLs received 50ng/mL LPS or vehicle (PBS) at the time of feeding, and they were characterized on D43. B) HPCs at day 12 of differentiation from iPSCs were fluorescently labeled for <t>CD43</t> (green) and DAPI (blue) and CD43+ cells were quantified (right; N = 3-5 independent preps, unpaired t test). C) Confocal image of iMGLs immunolabeled for Iba1 with phagocytosed fluorescent latex beads (left) and quantification of the percentage of phagocytic cells obtained via flow cytometry. (right; N = 3 independent preps, Unpaired t test). D) Representative confocal images of iMGLs immunolabeled for PU.1 (red) and Iba1 (green) and stained with DAPI (white), with quantification of the percentage of PU.1- and Iba1-expressing iMGLs (right; N = 4 independent preps; Unpaired t test). E) Immunofluorescent labeling of Trem2 (red) and P2RY12 (green) in iMGLs with a 7-day treatment of either PBS or 50ng/mL LPS. F) Representative images of iMGLs with immunolabeling of PU.1 (blue) and BODIPY-493/503 labeling of LDs. LDs were quantified per cell and plotted as the fold-change relative to the average of the E3 PBS condition (N = 23-25 wells from 4 independent experiments; Two-way ANOVA with Fisher’s LSD Test). G) RT-qPCR characterization for D31 iMGLs treated with PBS or LPS. Plots show relative expression (2^ΔCt) to housekeeping gene PP1A (N = 3 independent experiments; Two-way ANOVA with Fisher’s LSD Test). All bar graphs represent the mean with error bars representing SEM. * p < 0.05, ** p < 0.01, *** p < 0.001, and **** p < 0.0001.
Cd43 Ly 48 Microbeads, supplied by Miltenyi Biotec, used in various techniques. Bioz Stars score: 95/100, based on 1 PubMed citations. ZERO BIAS - scores, article reviews, protocol conditions and more
https://www.bioz.com/result/cd43 ly 48 microbeads/product/Miltenyi Biotec
Average 95 stars, based on 1 article reviews
cd43 ly 48 microbeads - by Bioz Stars, 2026-05
95/100 stars
  Buy from Supplier

93
Miltenyi Biotec anti cd43 apc vio770
A) Timeline of microglial differentiation. iMGLs were generated from iPSCs following the protocol from McQuade et al., 2018. On days 36, 38, 40, and 42, iMGLs received 50ng/mL LPS or vehicle (PBS) at the time of feeding, and they were characterized on D43. B) HPCs at day 12 of differentiation from iPSCs were fluorescently labeled for <t>CD43</t> (green) and DAPI (blue) and CD43+ cells were quantified (right; N = 3-5 independent preps, unpaired t test). C) Confocal image of iMGLs immunolabeled for Iba1 with phagocytosed fluorescent latex beads (left) and quantification of the percentage of phagocytic cells obtained via flow cytometry. (right; N = 3 independent preps, Unpaired t test). D) Representative confocal images of iMGLs immunolabeled for PU.1 (red) and Iba1 (green) and stained with DAPI (white), with quantification of the percentage of PU.1- and Iba1-expressing iMGLs (right; N = 4 independent preps; Unpaired t test). E) Immunofluorescent labeling of Trem2 (red) and P2RY12 (green) in iMGLs with a 7-day treatment of either PBS or 50ng/mL LPS. F) Representative images of iMGLs with immunolabeling of PU.1 (blue) and BODIPY-493/503 labeling of LDs. LDs were quantified per cell and plotted as the fold-change relative to the average of the E3 PBS condition (N = 23-25 wells from 4 independent experiments; Two-way ANOVA with Fisher’s LSD Test). G) RT-qPCR characterization for D31 iMGLs treated with PBS or LPS. Plots show relative expression (2^ΔCt) to housekeeping gene PP1A (N = 3 independent experiments; Two-way ANOVA with Fisher’s LSD Test). All bar graphs represent the mean with error bars representing SEM. * p < 0.05, ** p < 0.01, *** p < 0.001, and **** p < 0.0001.
Anti Cd43 Apc Vio770, supplied by Miltenyi Biotec, used in various techniques. Bioz Stars score: 93/100, based on 1 PubMed citations. ZERO BIAS - scores, article reviews, protocol conditions and more
https://www.bioz.com/result/anti cd43 apc vio770/product/Miltenyi Biotec
Average 93 stars, based on 1 article reviews
anti cd43 apc vio770 - by Bioz Stars, 2026-05
93/100 stars
  Buy from Supplier

90
Miltenyi Biotec anti mouse cd43 l11 pe

Anti Mouse Cd43 L11 Pe, supplied by Miltenyi Biotec, used in various techniques. Bioz Stars score: 90/100, based on 1 PubMed citations. ZERO BIAS - scores, article reviews, protocol conditions and more
https://www.bioz.com/result/anti mouse cd43 l11 pe/product/Miltenyi Biotec
Average 90 stars, based on 1 article reviews
anti mouse cd43 l11 pe - by Bioz Stars, 2026-05
90/100 stars
  Buy from Supplier

Image Search Results


a. Spleen weight of wild-type (WT) and Ftx KO females at 3-months, 1-year and 2-years of age. Median values are shown. ( t-test , * p -values < 0.05). Underneath, representative images of WT and Ftx KO spleens from 3-month, 1-year and 2-year-old females. b. Representative images of hematoxylin-eosin staining on sections of spleens from 1-year-old WT and Ftx KO females. Scale bar; 100 μm. c. Representative flow cytometry analysis of splenic myeloid dendritic cells (m-DC) in WT and Ftx KO 1-year-old females. On the right, percentages of splenic m-DC (CD11b + CD11c + ) and splenic plasmacytoid dendritic cells (p-DC) (CD11c + B220 + SiglecH + ) in leucocytes. Each triangle represents a mouse. Median values are shown. ( t-test , * p -values < 0.05). d. Representative flow cytometry analysis of spontaneously activated B cells (B220 + CD69 + ) (upper panels) or of spontaneously activated T cells (CD4 + CD69 + ) (lower panels) in spleen from 1-year-old WT and Ftx KO females. Percentages in leucocytes are shown on the graphs beneath. Each triangle represents a mouse. Median values are shown. ( t-test , * p -values < 0.05). e. IgG2a natural antibody levels in sera of 1-year- and 2-year-old WT or Ftx KO females measured by ELISA. Each triangle represents a mouse. Median values are shown. ( t-test , * p -values < 0.05). f. Representative flow cytometry analysis of (B220 + CD138 + ) plasma cells in the spleen of 1-year-old WT and Ftx KO females. Percentages in leucocytes are shown on the graphs beneath. Each triangle represents a mouse. Median values are shown. ( t-test , * p -values < 0.05). g. Representative flow cytometry analysis of (CD19 + B220 lo CD5 + ) natural antibody producing B1a in the peritoneal cavity (PerC) of 1-year-old WT and Ftx KO females. Percentages in leucocytes are shown on the graphs beneath. Each triangle represents a mouse. Median values are shown. ( t-test , * p -values < 0.05). h. Cytokines levels in the blood analysed with CBA assays on sera from 3-month-, 1-year-, or 2-year-old WT and Ftx KO females. Each triangle represents a mouse. Median values are shown. ( t-test , * p -values < 0.05). i. Representative flow cytometry analysis of monocyte populations including non-classical (CD11b hi CD43 lo Ly6C + ) scavenger monocytes in the spleen of 1-year-old WT and Ftx KO females. Percentages in leucocytes are shown on the graphs beneath. Each triangle represents a mouse. Median values are shown. ( t-test , * p -values < 0.05).

Journal: bioRxiv

Article Title: Altered X-chromosome inactivation predisposes to autoimmune manifestations in mice

doi: 10.1101/2023.04.20.537662

Figure Lengend Snippet: a. Spleen weight of wild-type (WT) and Ftx KO females at 3-months, 1-year and 2-years of age. Median values are shown. ( t-test , * p -values < 0.05). Underneath, representative images of WT and Ftx KO spleens from 3-month, 1-year and 2-year-old females. b. Representative images of hematoxylin-eosin staining on sections of spleens from 1-year-old WT and Ftx KO females. Scale bar; 100 μm. c. Representative flow cytometry analysis of splenic myeloid dendritic cells (m-DC) in WT and Ftx KO 1-year-old females. On the right, percentages of splenic m-DC (CD11b + CD11c + ) and splenic plasmacytoid dendritic cells (p-DC) (CD11c + B220 + SiglecH + ) in leucocytes. Each triangle represents a mouse. Median values are shown. ( t-test , * p -values < 0.05). d. Representative flow cytometry analysis of spontaneously activated B cells (B220 + CD69 + ) (upper panels) or of spontaneously activated T cells (CD4 + CD69 + ) (lower panels) in spleen from 1-year-old WT and Ftx KO females. Percentages in leucocytes are shown on the graphs beneath. Each triangle represents a mouse. Median values are shown. ( t-test , * p -values < 0.05). e. IgG2a natural antibody levels in sera of 1-year- and 2-year-old WT or Ftx KO females measured by ELISA. Each triangle represents a mouse. Median values are shown. ( t-test , * p -values < 0.05). f. Representative flow cytometry analysis of (B220 + CD138 + ) plasma cells in the spleen of 1-year-old WT and Ftx KO females. Percentages in leucocytes are shown on the graphs beneath. Each triangle represents a mouse. Median values are shown. ( t-test , * p -values < 0.05). g. Representative flow cytometry analysis of (CD19 + B220 lo CD5 + ) natural antibody producing B1a in the peritoneal cavity (PerC) of 1-year-old WT and Ftx KO females. Percentages in leucocytes are shown on the graphs beneath. Each triangle represents a mouse. Median values are shown. ( t-test , * p -values < 0.05). h. Cytokines levels in the blood analysed with CBA assays on sera from 3-month-, 1-year-, or 2-year-old WT and Ftx KO females. Each triangle represents a mouse. Median values are shown. ( t-test , * p -values < 0.05). i. Representative flow cytometry analysis of monocyte populations including non-classical (CD11b hi CD43 lo Ly6C + ) scavenger monocytes in the spleen of 1-year-old WT and Ftx KO females. Percentages in leucocytes are shown on the graphs beneath. Each triangle represents a mouse. Median values are shown. ( t-test , * p -values < 0.05).

Article Snippet: Bone marrow, spleen, blood and peritoneal cavity cells were stained using the following antibodies: CD3 PerCP-Vio770 (130-119-656, Miltenyi Biotec), CD4-APC (130-123-207, Miltenyi Biotec), CD5-APC-Vio770 (130-120-165, Miltenyi Biotec), CD8-FITC (130-118-468, Miltenyi Biotec), CD11b APC (553312, BD Pharmingen), CD11c PE-Vio770 (130-110-840, Miltenyi Biotec), CD19-FITC (557398, BD Pharmingen), CD21-APC-Vio770 (130-111-733, Miltenyi Biotec), CD23-PE-Vio770 (130-118-764, Miltenyi Biotec), CD38-PE (130-123-571, Miltenyi Biotec), CD43-PE (130-112-887, Miltenyi Biotec), CD69-PE (130-115-575, Miltenyi Biotec), CD138 PE-Vio615 (130-108-989, Miltenyi Biotec), F4/80 FITC (130-117-509, Miltenyi Biotec), Ter119 PE (130-112-909, Miltenyi Biotec), SiglecH APC-Vio770 (130-112-299, Miltenyi Biotec), B220-APC (130-110-847, Miltenyi Biotec), B220 VioBlue (130-110-851, Miltenyi Biotec), IgM-VioBlue (130-116-318, Miltenyi Biotec), IgD-PE (130-111-496, Miltenyi Biotec), GL7-PE-Cy7 (144619, BioLegend), Ly6C-FITC (130-111-915, Miltenyi Biotec) following recommendations of the manufacturers.

Techniques: Staining, Flow Cytometry, Enzyme-linked Immunosorbent Assay, Clinical Proteomics

A) Timeline of microglial differentiation. iMGLs were generated from iPSCs following the protocol from McQuade et al., 2018. On days 36, 38, 40, and 42, iMGLs received 50ng/mL LPS or vehicle (PBS) at the time of feeding, and they were characterized on D43. B) HPCs at day 12 of differentiation from iPSCs were fluorescently labeled for CD43 (green) and DAPI (blue) and CD43+ cells were quantified (right; N = 3-5 independent preps, unpaired t test). C) Confocal image of iMGLs immunolabeled for Iba1 with phagocytosed fluorescent latex beads (left) and quantification of the percentage of phagocytic cells obtained via flow cytometry. (right; N = 3 independent preps, Unpaired t test). D) Representative confocal images of iMGLs immunolabeled for PU.1 (red) and Iba1 (green) and stained with DAPI (white), with quantification of the percentage of PU.1- and Iba1-expressing iMGLs (right; N = 4 independent preps; Unpaired t test). E) Immunofluorescent labeling of Trem2 (red) and P2RY12 (green) in iMGLs with a 7-day treatment of either PBS or 50ng/mL LPS. F) Representative images of iMGLs with immunolabeling of PU.1 (blue) and BODIPY-493/503 labeling of LDs. LDs were quantified per cell and plotted as the fold-change relative to the average of the E3 PBS condition (N = 23-25 wells from 4 independent experiments; Two-way ANOVA with Fisher’s LSD Test). G) RT-qPCR characterization for D31 iMGLs treated with PBS or LPS. Plots show relative expression (2^ΔCt) to housekeeping gene PP1A (N = 3 independent experiments; Two-way ANOVA with Fisher’s LSD Test). All bar graphs represent the mean with error bars representing SEM. * p < 0.05, ** p < 0.01, *** p < 0.001, and **** p < 0.0001.

Journal: bioRxiv

Article Title: Microglia-to-neuron signaling increases lipid droplet metabolism, enhancing neuronal network activity

doi: 10.1101/2025.08.03.668224

Figure Lengend Snippet: A) Timeline of microglial differentiation. iMGLs were generated from iPSCs following the protocol from McQuade et al., 2018. On days 36, 38, 40, and 42, iMGLs received 50ng/mL LPS or vehicle (PBS) at the time of feeding, and they were characterized on D43. B) HPCs at day 12 of differentiation from iPSCs were fluorescently labeled for CD43 (green) and DAPI (blue) and CD43+ cells were quantified (right; N = 3-5 independent preps, unpaired t test). C) Confocal image of iMGLs immunolabeled for Iba1 with phagocytosed fluorescent latex beads (left) and quantification of the percentage of phagocytic cells obtained via flow cytometry. (right; N = 3 independent preps, Unpaired t test). D) Representative confocal images of iMGLs immunolabeled for PU.1 (red) and Iba1 (green) and stained with DAPI (white), with quantification of the percentage of PU.1- and Iba1-expressing iMGLs (right; N = 4 independent preps; Unpaired t test). E) Immunofluorescent labeling of Trem2 (red) and P2RY12 (green) in iMGLs with a 7-day treatment of either PBS or 50ng/mL LPS. F) Representative images of iMGLs with immunolabeling of PU.1 (blue) and BODIPY-493/503 labeling of LDs. LDs were quantified per cell and plotted as the fold-change relative to the average of the E3 PBS condition (N = 23-25 wells from 4 independent experiments; Two-way ANOVA with Fisher’s LSD Test). G) RT-qPCR characterization for D31 iMGLs treated with PBS or LPS. Plots show relative expression (2^ΔCt) to housekeeping gene PP1A (N = 3 independent experiments; Two-way ANOVA with Fisher’s LSD Test). All bar graphs represent the mean with error bars representing SEM. * p < 0.05, ** p < 0.01, *** p < 0.001, and **** p < 0.0001.

Article Snippet: Primary antibodies used in this study: Nanog (1:500, Thermo Fisher, PA5-85110), Oct4 (1:100, Thermo Fisher, MA1-104), Sox2 (1:400, Cell Signaling, 3579), and SSEA4 (1:150, Abcam, 16287), βIII-tubulin (1:250, Synaptic Systems, 302304), NeuN (1:500, Sigma, MAB377), Cult1 (1:500, Abnova, H00001523-M01), vGlut1 (1:500, Synaptic Systems, 135318), vGlut2 (1:500, Novus Biologicals, NBP2-94571), Gad67 (1:500, EMD Millipore, MAB5406MI), synapsin 1/2 (1:1000, Synaptic Systems, 106002), CD43 (1:100, R&D Systems, MAB2038), PU.1 (1:100, Cell Signaling Technologies, 2266), Iba1 (1:100, Fisher Scientific, PIPA518488), P2RY12 (1:50, Sigma, HPA014518), Trem2 (1:100, R&D Systems, AF1828).

Techniques: Generated, Labeling, Immunolabeling, Flow Cytometry, Staining, Expressing, Quantitative RT-PCR

Journal: Cell

Article Title: Spatial proteogenomics reveals distinct and evolutionarily conserved hepatic macrophage niches

doi: 10.1016/j.cell.2021.12.018

Figure Lengend Snippet:

Article Snippet: Anti-Mouse CD43 (L11) PE , Miltenyi Biotec , 130-102-594; RRID: AB_2661309.

Techniques: Purification, Recombinant, Staining, cDNA Synthesis, Gene Expression, Software, Microscopy