|
Proteintech
cpsf5 Cpsf5, supplied by Proteintech, used in various techniques. Bioz Stars score: 94/100, based on 1 PubMed citations. ZERO BIAS - scores, article reviews, protocol conditions and more https://www.bioz.com/product/25kda/NUDT21+Antibody/pm26330467-288-53-54 Average 94 stars, based on 1 article reviews
cpsf5 - by Bioz Stars,
2026-09
94/100 stars
|
Buy from Supplier |
|
Kyfora Bio
polyethylenimine Polyethylenimine, supplied by Kyfora Bio, used in various techniques. Bioz Stars score: 99/100, based on 1 PubMed citations. ZERO BIAS - scores, article reviews, protocol conditions and more https://www.bioz.com/product/25kda/PEI+25K+Transfection+Reagent/bio_rxiv__64898__2026__05__08__723688-167-0-1 Average 99 stars, based on 1 article reviews
polyethylenimine - by Bioz Stars,
2026-09
99/100 stars
|
Buy from Supplier |
|
Proteintech
anti tfam Anti Tfam, supplied by Proteintech, used in various techniques. Bioz Stars score: 93/100, based on 1 PubMed citations. ZERO BIAS - scores, article reviews, protocol conditions and more https://www.bioz.com/product/25kda/FKBP3+Antibody/pmc07986523-54-0-2 Average 93 stars, based on 1 article reviews
anti tfam - by Bioz Stars,
2026-09
93/100 stars
|
Buy from Supplier |
|
Proteintech
eif4e  Eif4e, supplied by Proteintech, used in various techniques. Bioz Stars score: 93/100, based on 1 PubMed citations. ZERO BIAS - scores, article reviews, protocol conditions and more https://www.bioz.com/product/25kda/CBP%2CEIF4E+Antibody/pmc12894277-132-37-40 Average 93 stars, based on 1 article reviews
eif4e - by Bioz Stars,
2026-09
93/100 stars
|
Buy from Supplier |
|
Proteintech
anti spcs2 rabbit polyclonal antibody  Anti Spcs2 Rabbit Polyclonal Antibody, supplied by Proteintech, used in various techniques. Bioz Stars score: 93/100, based on 1 PubMed citations. ZERO BIAS - scores, article reviews, protocol conditions and more https://www.bioz.com/product/25kda/SPCS2+Antibody/bio_rxiv__2022__12__10__519934-209-125-131 Average 93 stars, based on 1 article reviews
anti spcs2 rabbit polyclonal antibody - by Bioz Stars,
2026-09
93/100 stars
|
Buy from Supplier |
|
ProSci Incorporated
sars cov2 m1 sars cov2 m1 sars cov2 m1 Sars Cov2 M1 Sars Cov2 M1 Sars Cov2 M1, supplied by ProSci Incorporated, used in various techniques. Bioz Stars score: 92/100, based on 1 PubMed citations. ZERO BIAS - scores, article reviews, protocol conditions and more https://www.bioz.com/product/25kda/SNAP25+Antibody/us12018065-1233-12-1 Average 92 stars, based on 1 article reviews
sars cov2 m1 sars cov2 m1 sars cov2 m1 - by Bioz Stars,
2026-09
92/100 stars
|
Buy from Supplier |
|
Proteintech
anti eif4e Anti Eif4e, supplied by Proteintech, used in various techniques. Bioz Stars score: 93/100, based on 1 PubMed citations. ZERO BIAS - scores, article reviews, protocol conditions and more https://www.bioz.com/product/25kda/EIF4E+Antibody/pmc11623866-74-11-15 Average 93 stars, based on 1 article reviews
anti eif4e - by Bioz Stars,
2026-09
93/100 stars
|
Buy from Supplier |
|
OriGene
full length myc ddk tagged mouse fkbp3  Full Length Myc Ddk Tagged Mouse Fkbp3, supplied by OriGene, used in various techniques. Bioz Stars score: 90/100, based on 1 PubMed citations. ZERO BIAS - scores, article reviews, protocol conditions and more https://www.bioz.com/product/25kda/Fkbp3+(NM_013902)+Mouse+Tagged+ORF+Clone/pmc08881485-215-4-23 Average 90 stars, based on 1 article reviews
full length myc ddk tagged mouse fkbp3 - by Bioz Stars,
2026-09
90/100 stars
|
Buy from Supplier |
|
ProSci Incorporated
p hsp27 s15  P Hsp27 S15, supplied by ProSci Incorporated, used in various techniques. Bioz Stars score: 90/100, based on 1 PubMed citations. ZERO BIAS - scores, article reviews, protocol conditions and more https://www.bioz.com/product/25kda/HSP27+(phospho+Ser15)+Antibody/pmc07352409-232-7-10 Average 90 stars, based on 1 article reviews
p hsp27 s15 - by Bioz Stars,
2026-09
90/100 stars
|
Buy from Supplier |
|
MedChemExpress
lig Lig, supplied by MedChemExpress, used in various techniques. Bioz Stars score: 91/100, based on 1 PubMed citations. ZERO BIAS - scores, article reviews, protocol conditions and more https://www.bioz.com/product/25kda/UBE2K%2C+Human/pm36561613-39-6-7 Average 91 stars, based on 1 article reviews
lig - by Bioz Stars,
2026-09
91/100 stars
|
Buy from Supplier |
|
MedChemExpress
fkbp3 his ask1  Fkbp3 His Ask1, supplied by MedChemExpress, used in various techniques. Bioz Stars score: 86/100, based on 1 PubMed citations. ZERO BIAS - scores, article reviews, protocol conditions and more https://www.bioz.com/product/25kda/FKBP3%2C+Human/pm29912587-118-26-5 Average 86 stars, based on 1 article reviews
fkbp3 his ask1 - by Bioz Stars,
2026-09
86/100 stars
|
Buy from Supplier |
|
Boster Bio
mouse anti his tag mab Mouse Anti His Tag Mab, supplied by Boster Bio, used in various techniques. Bioz Stars score: 93/100, based on 1 PubMed citations. ZERO BIAS - scores, article reviews, protocol conditions and more https://www.bioz.com/product/25kda/Human+SNAP25+Recombinant+Protein/pm41621331-65-22-25 Average 93 stars, based on 1 article reviews
mouse anti his tag mab - by Bioz Stars,
2026-09
93/100 stars
|
Buy from Supplier |
Image Search Results
Journal: Frontiers in Neurology
Article Title: Identification of m1A/m6A/m5C/m7G-related genes and clusters associated with neuropathic pain
doi: 10.3389/fneur.2026.1592545
Figure Lengend Snippet: Validation of expression of the six m1A/m6A/m5C/m7G-related DEGs ( FTO , METTL3 , NSUN2 , YTHDF3 , WDR4 , and EIF4E ) in rats after 3, 7, and 14 days of SNL surgery. n = 3 per group. SNL, spinal nerve ligation. (A) qPCR results. (B) Western blot analysis results. * p < 0.05.
Article Snippet: After blocking, the membranes were incubated with the following primary antibodies: Nsun2 (1:1000, PH6626, ab-mart, Shanghai, China), Mettl3 (1:1000, 15,073-1-AP, Proteintech, Rosemont, IL, United States), Ythdf3 (1:500, 25,537-1-AP, Proteintech), FTO (1:1000, PA2776, ab-mart); Wdr4 (1:1000, PS17092, ab-mart),
Techniques: Biomarker Discovery, Expressing, Ligation, Western Blot
Journal: bioRxiv
Article Title: Cleavage of the Jaw1 C-terminal region enhances its augmentative effect on the Ca 2+ release via inositol 1,4,5-trisphosphate receptors
doi: 10.1101/2022.12.10.519934
Figure Lengend Snippet: Flp-In T-REx HEK293 Hu Jaw1 cells were treated with siRNA against spcs1, spcs2 , and spcs3 for 48 h. After 24 h from the start of siRNA treatment, the cells were treated with Dox for 24 h. A-C ) Graphs showing the relative expression levels to NT of spcs1 (A), spcs2 (B), and spcs3 (C) mRNA to gapdh measured by RT-qPCR. D ) The cell lysates were subjected to western blotting. E-G ) Graphs showing the relative expression level of SPCS1 (E), SPCS2 (F), and SEC11A (G) in (D). H ) Graph showing the percentage of Jaw1 C-terminal cleavage in (D). A-C, E-H ) The averages of three independent experiments per condition are shown in the graphs. Error bar shows ±SD, “n.s.”, not significant; * P < 0.05; ** P < 0.01; *** P < 0.001; **** P < 0.0001. Statistics: one-way ANOVA followed by Dunnett’s multiple comparison test.
Article Snippet: The membranes were blocked in 3% skim milk (#190-12865; FUJIFILM Wako Pure Chemical Corporation, Tokyo, Japan) diluted with Tris-buffered saline (TBS) (20 mM Tris–HCl pH 7.6 and 137 mM NaCl) containing 0.1% Tween-20 (TBS-T) for 1 h. After washing the membrane with TBS-T, it was reacted with the following primary antibodies diluted with 1% skim milk/TBS-T overnight at 4°C: anti-FLAG mouse antibody (1:1000) (#014-23383; FUJIFILM Wako Pure Chemical Corporation, Tokyo, Japan), anti-GAPDH mouse monoclonal antibody (1:1000) (#016-25523; FUJIFILM Wako Pure Chemical Corporation, Tokyo, Japan), anti-Jaw1 Coil rat antibody (1:500 or 1:1000) (produced in our laboratory as previously described ( Kozono et al ., 2018 )), anti-SEC11A rabbit polyclonal antibody (1:1000) (#14753-1-AP; Proteintech, Wuhan, Hubei, China), anti-SPCS1 rabbit polyclonal antibody (1:1000) (#11847-1-AP; Proteintech, Wuhan, Hubei, China),
Techniques: Expressing, Quantitative RT-PCR, Western Blot, Comparison
Journal: bioRxiv
Article Title: Cleavage of the Jaw1 C-terminal region enhances its augmentative effect on the Ca 2+ release via inositol 1,4,5-trisphosphate receptors
doi: 10.1101/2022.12.10.519934
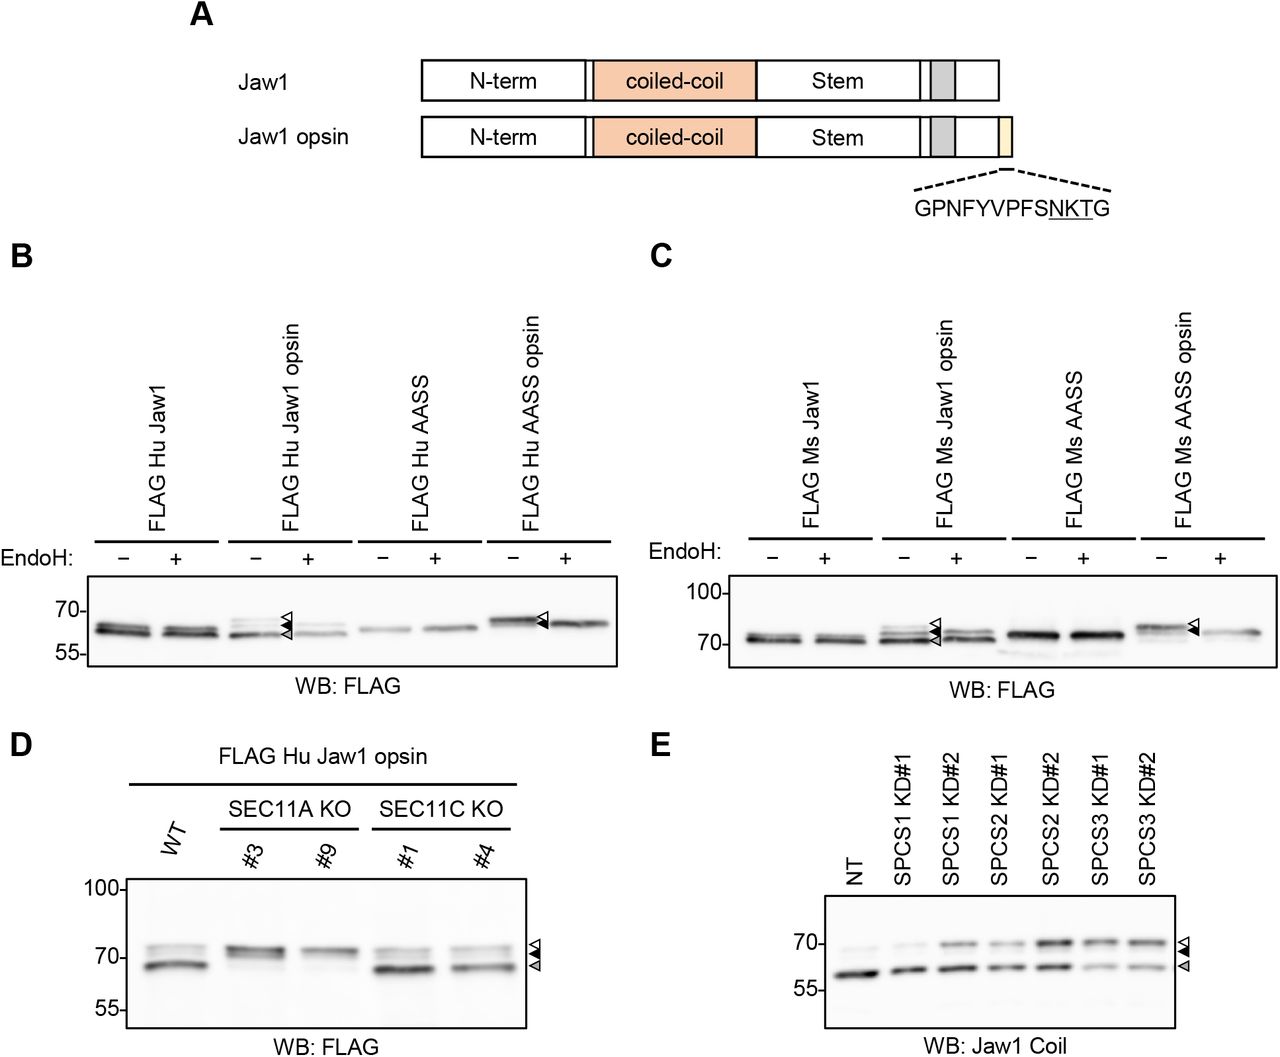
Figure Lengend Snippet: A ) Schematic representation of Jaw1 and Jaw1 opsin. The opsin tag was added to its C-terminal end. B, C ) FLAG Hu Jaw1, FLAG Hu Jaw1 opsin, FLAG Hu AASS, and FLAG Hu AASS opsin (B) and FLAG Ms Jaw1, FLAG Ms Jaw1 opsin, FLAG Ms AASS, and FLAG Ms AASS opsin (C) were expressed in HEK293 cells by transfection. After incubation for 24 h, the lysates samples were treated with or without EndoH and subjected to western blotting using an anti-FLAG mouse antibody. D ) FLAG Hu Jaw1 opsin was expressed in SEC11A KO #3 and #9 and SEC11C KO #1 and #4 cells by transfection. After incubation for 24 h, the lysates were subjected to western blotting using an anti-FLAG mouse antibody. E ) Flp-In T-REx HEK293 Hu Jaw1 opsin cells were treated with siRNA against spcs1, spcs2 , and spcs3 for 48 h. After 24 h from the start of siRNA treatment, the cells were treated with Dox for 24 h. After that, the lysates were subjected to western blotting using an anti-Jaw1 Coil antibody. Hu Jaw1 opsin expressed by the treatment with Dox in this cell does not bear the N-terminal tags unlike FLAG Hu Jaw1 opsin in (B) and (D), thereby, an anti-Jaw1 Coil antibody but not an anti-FLAG mouse antibody was used. B-E ) Open triangles, the bands of ER-inserted uncleaved Jaw1 with N -linked glycosylation; closed triangles, the bands of the pre-inserted Jaw1(black) and cleaved Jaw1 (gray). The representative blot images from three independent experiments with similar results are shown.
Article Snippet: The membranes were blocked in 3% skim milk (#190-12865; FUJIFILM Wako Pure Chemical Corporation, Tokyo, Japan) diluted with Tris-buffered saline (TBS) (20 mM Tris–HCl pH 7.6 and 137 mM NaCl) containing 0.1% Tween-20 (TBS-T) for 1 h. After washing the membrane with TBS-T, it was reacted with the following primary antibodies diluted with 1% skim milk/TBS-T overnight at 4°C: anti-FLAG mouse antibody (1:1000) (#014-23383; FUJIFILM Wako Pure Chemical Corporation, Tokyo, Japan), anti-GAPDH mouse monoclonal antibody (1:1000) (#016-25523; FUJIFILM Wako Pure Chemical Corporation, Tokyo, Japan), anti-Jaw1 Coil rat antibody (1:500 or 1:1000) (produced in our laboratory as previously described ( Kozono et al ., 2018 )), anti-SEC11A rabbit polyclonal antibody (1:1000) (#14753-1-AP; Proteintech, Wuhan, Hubei, China), anti-SPCS1 rabbit polyclonal antibody (1:1000) (#11847-1-AP; Proteintech, Wuhan, Hubei, China),
Techniques: Transfection, Incubation, Western Blot, Glycoproteomics
Journal: The Journal of Biological Chemistry
Article Title: FK506-binding protein-like and FK506-binding protein 8 regulate dual leucine zipper kinase degradation and neuronal responses to axon injury
doi: 10.1016/j.jbc.2022.101647
Figure Lengend Snippet: FKBPL and FKBP8 induced lysosome-dependent DLK degradation. A , comparative analysis of relative expression levels in mouse L4,5 dorsal root ganglion (DRG) tissues, sciatic nerve tissues, and cultured embryonic DRG neurons ( , , , ). Red and blue circles indicate Illumina short-read sequencing and Oxford Nanopore direct RNA long-read sequencing, respectively. Circle sizes indicate relative levels of microarray data from cultured embryonic DRG neurons. B , Western blot analysis for the expression of DLK with FKBPs (N; null vector, L; FKBPL, 3; FKBP3, 4; FKBP4, 8; FKBP8, 12; FKBP12, 14; FKBP14, 15; FKBP15). The number indicates normalized relative intensity. Dual leucine zipper kinase and FLAG-epitope-tagged FKBP protein family members were expressed in HEK293T cells and subjected to SDS-PAGE. C , Western blot analysis for the immunoprecipitation of DLK with mouse (m) and human (h) FKBP4/8 that was overexpressed in HEK293T cells. Empty arrowhead , non-specific band; blue arrowhead , FKBP4; red arrowhead , FKBP8. D , Western blot analysis for the expression of DLK and FKBPL/4/8 expressed in HEK293T cells with or without bafilomycin A1 treatment. The numbers indicate the normalized relative intensity. E , Western blot analysis of DLK protein levels under Fkbp8 knockdown (sh Fkbp8 ) by lentiviral delivery in primary cultured embryonic DRG neurons. The numbers indicate the normalized relative intensity. F , statistical analysis of ( E ) (FC, fold change; n = 3 for each condition; ∗ p < 0.05 by t test; mean ± S.E.M.). DLK, dual leucine zipper kinase.
Article Snippet: An expression plasmid for
Techniques: Expressing, Cell Culture, Sequencing, Microarray, Western Blot, Plasmid Preparation, FLAG-tag, SDS Page, Immunoprecipitation, Knockdown
Journal: Cancers
Article Title: Specific Roles of HSP27 S15 Phosphorylation Augmenting the Nuclear Function of HER2 to Promote Trastuzumab Resistance
doi: 10.3390/cancers12061540
Figure Lengend Snippet: Heat shock protein 27 (HSP27) plays a negative prognostic role in human epidermal growth factor receptor 2 (HER2)-positive breast cancer (BC). ( A ) The relapse-free survival rate of patients with different HSP27 expression levels was assessed through a survival analysis using a KM plotter ( http://kmplot.com/analysis ). A total of 251 patients were included in the analysis. * p = 0.046, log rank test. ( B ) The distant metastasis–free survival probability of HSP27-high and -low patients was analyzed using KM plotter. A total of 119 patients were involved in the assessment. ** p = 0.0041, log rank test. ( C ) A total of 114 HER2 + patients from GSE50948 were classified into two groups. Those with a log2 robust multi-array average expression value of HSPB1 in the top 30% ( n = 34 ) were assigned to the HSP27 High group, and those in the bottom 30% of HSPB1 values ( n = 34 ) were categorized as the HSP27 Low group. Student’s t-test, *** p < 0.001. ( D ) The pathological complete response (pCR) and residual disease (RD) rates of the HSP27 High and HSP27 High groups were calculated. The patients in the HSP27 High group were more likely to remain in RD status, regardless of their regimen subtype.
Article Snippet: IHC was performed with the following antibodies:
Techniques: Expressing

Journal: Cancers
Article Title: Specific Roles of HSP27 S15 Phosphorylation Augmenting the Nuclear Function of HER2 to Promote Trastuzumab Resistance
doi: 10.3390/cancers12061540
Figure Lengend Snippet: HSP27 is critically engaged in trastuzumab (TZMB)-resistance (TR) in HER2 + BC. ( A ) Resistance development was assessed every four weeks. The TZMB-mediated growth inhibitory effect decreased gradually and reached a level lower than that of the JIMT-1 cells at 16 weeks. Analysis of variance (ANOVA), *** p < 0.001 versus BT-P. ( B ) Changes in the HSP27 and HER2 levels were assessed in cell lines developing TZMB-resistance. Alterations in the HER2 level show a direct correlation with the HSP27 level. ( C ) mRNA levels of HSP27 and HER2 were evaluated in the BT-P and BT-TR cell lines. The HSP27 mRNA level was significantly upregulated in BT-TR cells, whereas no changes were observed in the HER2 mRNA level ( n = 3 ). Student’s t-test, *** p < 0.001 versus BT-P. ( D ) Changes in several signaling pathways were comprehensively evaluated in TZMB-resistant cell lines. ( E – G ) Gene expression levels of HSP27 ( E ) HER2 ( F ) and HSF1 ( G ) were compared between complete responders (CR) and partial responders (PR) to TZMB (GSE62327). Significant alteration was found only in HSP27. Student’s t-test, * p < 0.05.
Article Snippet: IHC was performed with the following antibodies:
Techniques: Protein-Protein interactions, Gene Expression

Journal: Cancers
Article Title: Specific Roles of HSP27 S15 Phosphorylation Augmenting the Nuclear Function of HER2 to Promote Trastuzumab Resistance
doi: 10.3390/cancers12061540
Figure Lengend Snippet: HSP27 directly modulates HER2 and its downstream protein kinase B (AKT) pathway to induce TZMB-resistance in HER2 + BC. ( A ) Direct interactions between HSP27 and HER2 were confirmed in JIMT-1 cells using immunoprecipitation assay. ( B ) Extent of the HSP27 and HER2 interaction was compared between BT-P and BT-TR cells. Binding between the two proteins was increased in BT-TR cells and was significantly reduced along with HSP27 knockdown. ( C ) HSP27-mediated upregulation of HER2 was confirmed by transiently overexpressing HSP27. The fluorescence intensity of HER2 was increased only in those cells in which overexpression of HSP27 was successfully induced. Scale bars = 20 μM. ( D ) Alterations in the mRNA level were assessed by silencing HSP27 in BT-TR cells and restoring HSP27 expression in BT-TR shHSP27 cells. In all cases, the mRNA level of HER2 did not change significantly ( n = 3 ). ANOVA, *** p < 0.001. ( E ) The overexpression of HER2 and HSP27-mediated changes in the endogenous level of HER2 and HSP27 were evaluated. Transduction of HER2 did not change HSP27 expression. ( F – H ) Changes in TZMB responsiveness were assessed by silencing HSP27 in BT-TR cells and re-expressing HSP27 in BT-TR shHSP27 cells. HSP27 silencing significantly downregulated HER2 and phospho-AKT (p-AKT) (( F ) 12 h treatment of TZMB), leading to short-term (( G ) 48 h treatment of 10 μg/mL of TZMB) and long-term (( H ) 10-day incubation with TZMB) growth inhibition in response to TZMB. Inversely, restoration of HSP27 in BT-TR shHSP27 completely rescued the TZMB-resistant phenotype. ANOVA, *** p < 0.001.
Article Snippet: IHC was performed with the following antibodies:
Techniques: Immunoprecipitation, Binding Assay, Knockdown, Fluorescence, Over Expression, Expressing, Transduction, Incubation, Inhibition

Journal: Cancers
Article Title: Specific Roles of HSP27 S15 Phosphorylation Augmenting the Nuclear Function of HER2 to Promote Trastuzumab Resistance
doi: 10.3390/cancers12061540
Figure Lengend Snippet: Phosphorylation of HSP27 at serine 15 and 78 is required for interaction with HER2. ( A ) Gradual changes in HSP27 phosphorylation levels were assessed in TZMB-resistant cell lines. A distinctive increase in S15 and S78 phosphorylation was observed. No changes were found in S82 phosphorylation. ( B ) Changes in the interaction between HSP27 and HER2 were examined by reconstituting BT-TR shHSP27 cells with phospho-variants of HSP27. ( C ) (Left) Changes in HER2 fluorescence intensity were evaluated by transiently overexpressing each of the indicated HSP27 phospho-variants in BT-P cells (24 h transfection). Scale bars = 20 μM. (Right) The intensity of HER2 per cell was quantified using ImageJ software ( n = 4 ). Unlike the other phospho-variants, the non-phosphorylatable AAA mutant failed to make changes in the intensity of HER2. The S15D-containing mutants were confirmed to have the most significant influence on the endogenous HER2 level. ANOVA, ** p < 0.01, *** p < 0.001 vs. non-transfected cells. ( D ) Time-dependent changes in the endogenous levels of p-HSP27 S15 and p-HSP27 S78 were evaluated after separately and transiently transducing DAA and ADA. Pseudo-phosphorylation of S15 gradually induced the upregulation of the endogenous p-HSP27 S78 level. ANOVA, * p < 0.05, ** p < 0.01, and *** p < 0.001 versus 0 h. ( E , F ) The effect of HSP27 phosphorylation on TZMB-sensitivity was evaluated by transiently (( E ) TZMB was applied after 18 h of transfection and maintained for 6 h) and stably ( F ) introducing each indicated mutant to BT-P and BT-TR shHSP27 cells (14-day incubation with TZMB), respectively. The S15D-containing mutants significantly increased the stability of HER2 and prevented it from degrading in response to TZMB. ANOVA, *** p < 0.001 versus CON, ### p < 0.001 versus emp CON.
Article Snippet: IHC was performed with the following antibodies:
Techniques: Phospho-proteomics, Fluorescence, Transfection, Software, Mutagenesis, Stable Transfection, Incubation

Journal: Cancers
Article Title: Specific Roles of HSP27 S15 Phosphorylation Augmenting the Nuclear Function of HER2 to Promote Trastuzumab Resistance
doi: 10.3390/cancers12061540
Figure Lengend Snippet: Ser15-phosphorylated HSP27 significantly promotes nuclear localization of HER2. ( A ) Alterations in the sub-cytoplasmic and sub-nuclear level of HER2 and HSP27 were evaluated separately. HER2 and HSP27 were significantly upregulated in both subcellular fractions. ( B ) Changes in the function of nuclear HER2 were assessed by examining changes in the level of cyclin D1, which is the transcriptional target of HER2. A gradual increase was observed as resistance developed. ( C ) Changes in the HER2 fluorescence intensity were evaluated in BT-TR shHSP27 cells stably reconstituted with each of the indicated HSP27 phospho-variants. Scale bars = 20 μm ( D ) Quantification of HER2 intensity per cell was conducted using ImageJ (4 images per sample). HER2 intensity was most greatly elevated when S15D-harboring mutants were introduced. ANOVA, * p < 0.05, *** p < 0.001 vs. emp, # p < 0.05, ## p < 0.01, ### p < 0.001 vs. AAA ( E ) Subcellular HER2 intensity in each of the indicated cases was quantified separately using ImageJ software. The nuclear intensity of HER2 was highest in the cases harboring S15D mutations. ANOVA, ** p < 0.01, *** p < 0.001 vs. emp. ( F ) Independent changes in the cytoplasmic and nuclear HER2 expression levels were confirmed by transiently transducing the indicated HSP27 phospho-variants to BT-P cells. Both HER2 fractions displayed significant upregulation when the S15D mutation was present (24 h transfection). ( G ) Alterations in the colocalization pattern between each HSP27 phospho-variant and HER2 were evaluated through an immunofluorescence (IF) assay. Scale bars = 20 μM. Quantification of the colocalization extent was performed using ImageJ software. ( H ) Changes in the nuclear and cytoplasmic functions of HER2 were evaluated in reconstituted BT-TR shHSP27 cells by examining alterations in the cyclin D1 and p-AKT levels.
Article Snippet: IHC was performed with the following antibodies:
Techniques: Fluorescence, Stable Transfection, Software, Expressing, Mutagenesis, Transfection, Variant Assay, Immunofluorescence

Journal: Cancers
Article Title: Specific Roles of HSP27 S15 Phosphorylation Augmenting the Nuclear Function of HER2 to Promote Trastuzumab Resistance
doi: 10.3390/cancers12061540
Figure Lengend Snippet: J2 attenuates HER2 stability in TZMB-resistant BC cells by inhibiting the function of HSP27 through altering dimerization. ( A ) The activity of J2 as a direct functional inhibitor of HSP27 was confirmed using BT-TR shHSP27 cells. The compound lost its activity to create abnormal dimers of HSP27 and failed to downregulate HER2 and its downstream AKT pathway (12 h treatment at indicated concentrations). ( B ) The effect of J2 on the HSP27–HER2 interaction was evaluated by co-IP assay. The interaction between HER2 and HSP27 was significantly reduced in a dose-dependent manner by treatment with J2 (12 h treatment at the indicated concentrations). ( C ) J2-mediated downregulation of HER2 stability was assessed using a cycloheximide (CHX) chase assay. Co-treatment with CHX (5 μg/mL) and J2 (20 μM) accelerated the degradation of HER2 by creating altered dimers of HSP27. ( D ) Changes in the mRNA level of HSP27 and HER2 were measured after applying the compound at the indicated concentrations. No significant alterations were found in either HSP27 or HER2 mRNA expression (12 h treatment at indicated doses, qRT-PCR, ACTIN as loading control). ( E ) The effect of J2 on HER-related signaling molecules was evaluated in BT-TR cells by applying the compound in the indicated concentrations. Significant, concentration-dependent attenuation was observed in HER-family proteins and the downstream AKT pathway (12 h treatment at indicated doses). ( F ) Changes in the HER2 level in different subcellular fractions of BT-P and BT-TR cells were examined, to evaluate the influence of J2 on the cytoplasmic and nuclear functions of HER2. A significant decrease was observed in both fractions of HER2 (12 h treatment). ( G , H ) Consequential downregulation of cyclin D1 mRNA (G, 12 h treatment, ACTIN as loading control) and protein (( H ) 12 h treatment) was observed following J2 treatment. ANOVA, * p < 0.05, *** p < 0.001 versus CON.
Article Snippet: IHC was performed with the following antibodies:
Techniques: Activity Assay, Functional Assay, Co-Immunoprecipitation Assay, Expressing, Quantitative RT-PCR, Control, Concentration Assay

Journal: Cancers
Article Title: Specific Roles of HSP27 S15 Phosphorylation Augmenting the Nuclear Function of HER2 to Promote Trastuzumab Resistance
doi: 10.3390/cancers12061540
Figure Lengend Snippet: J2 sensitizes TZMB-resistant cell lines to successfully restore significant anticancer activity of TZMB. ( A ) The effect of co-treatment with J2 (10 μM) and TZMB (10 μg/mL) on HER2 and its downstream AKT signaling pathway was assessed in three different cell lines, BT-P, BT-TR, and JIMT-1. The HER2 and p-AKT levels were most significantly reduced in the co-treatment group, which also showed enhanced alterations in HSP27 dimerization (12 h treatment of both drugs). ( B ) Marked reduction in S15 and 78 phosphorylation was observed in the co-treatment group. No changes were found in S8 phosphorylation. The experimental conditions used in ( A ) were also applied here. ( C ) The effect of co-treatment with J2 (10 μM) and TZMB (10 μg/mL) on apoptosis signaling was assessed in three different cell lines, BT-P, BT-TR, and JIMT-1. Pro-apoptotic markers in the co-treatment group were significantly upregulated, along with enhanced alterations in HSP27 dimerization (24 h treatment of both drugs) ( D ) Remarkable synergism of growth inhibitory effect was observed in the group co-treated with J2 and TZMB (48 h treatment of both drugs). ANOVA, *** p < 0.001 versus TZMB-only group. ( E ) Long-term proliferation rate was also markedly inhibited in the TZMB + J2 group (10-day incubation). ANOVA, *** p < 0.001 versus CON.
Article Snippet: IHC was performed with the following antibodies:
Techniques: Activity Assay, Phospho-proteomics, Incubation

Journal: Cancers
Article Title: Specific Roles of HSP27 S15 Phosphorylation Augmenting the Nuclear Function of HER2 to Promote Trastuzumab Resistance
doi: 10.3390/cancers12061540
Figure Lengend Snippet: J2 successfully restored anticancer activity of TZMB in JIMT-1 xenograft mice. ( A ) In vivo tumor growth retardation effect of J2 was assessed using JIMT-1 xenograft mouse model ( n =6 per group, intraperitoneal injection, J2 was administered every other day, and TZMB was applied once a week). Tumor volumes were calculated by measuring the length and width of the tumor with calipers and using the equation (length x width 2 )/2 (mean ± S.E.M). Student’s t-test, * p < 0.05 versus control. ( B ) The tumor volumes of the mice from each treatment groups were compared with control tumors, all of which were excised immediately after sacrificing the mice ( n = 6 per group). Student’s t-test, * p < 0.05 versus CON. ( C ) Representative IHC images of HER2 and Ki67 from the tumors just described. 20x magnification. ( D ) The HER2 and Ki67 IHC scores were calculated using ImageJ software. * p < 0.05, ** p < 0.01, and *** p < 0.001 versus CON. ( E ) HER2 expression levels of the tumors excised from each of the groups. ( F ) Representative p-HSP27 S15 IHC images of tumors from each of the groups. 200x magnification. Quantification was performed using ImageJ software. * p < 0.05, ** p < 0.01, and *** p < 0.001 versus CON. ( G ) Representative IF images of HER2 and p-HSP27 S15 in tumor tissue from the JIMT-1 xenograft mice treated with each of the indicated drugs. Quantification was made on the merged nuclear intensity of HER2 and p-HSP27 S15 normalized by DAPI intensity and conducted in ImageJ (four images per sample). 400x magnification. ANOVA, ns = non-significant, * p < 0.05, ** p < 0.01, *** p < 0.001.
Article Snippet: IHC was performed with the following antibodies:
Techniques: Activity Assay, In Vivo, Injection, Control, Software, Expressing

Journal: Cancers
Article Title: Specific Roles of HSP27 S15 Phosphorylation Augmenting the Nuclear Function of HER2 to Promote Trastuzumab Resistance
doi: 10.3390/cancers12061540
Figure Lengend Snippet: Graphical summary of overall findings of the study. HSF1-mediated HSP27 upregulation and its S15 phosphorylation leads to increase in HER2 nuclear function, reducing the TZMB susceptibility overall. Administrating J2, a functional inhibitor of HSP27, can serve as an effective overcoming and/or preventing strategy for TZMB-resistance.
Article Snippet: IHC was performed with the following antibodies:
Techniques: Phospho-proteomics, Functional Assay
Journal: FASEB journal : official publication of the Federation of American Societies for Experimental Biology
Article Title: GPCR kinase 2-interacting protein-1 protects against ischemia-reperfusion injury of the spinal cord by modulating ASK1/JNK/p38 signaling.
doi: 10.1096/fj.201800548
Figure Lengend Snippet: Figure 7. GIT1 inhibits the activation of ASK1by by affecting the dimerization of ASK1. A) HEK293T cells cotransfected with His- ASK1 and other overexpression plasmids, including Myc-ASK1, Flag-GIT1, and Flag-GIT1 (ΔCC2), were subjected to OGD/R for 1 h. Total cell lysates were coimmunoprecipitated with His and probed for Myc and Flag. The interaction between His-ASK1 and Myc-ASK1 was suppressed after coexpression of Flag-GIT1, but not Flag-GIT1 (ΔCC2). B) Schematic representation of synthetic oligomerization constructs for FKBP3-His-ASK1. C) HEK293T cells that stably express FKBP3-His-ASK1 and Flag-GIT1 or Flag- GIT1 (ΔCC2) were pretreated with 100 nM AP20187 for 0.5 h followed by OGD/R for 1 h. Activation of ASK1 was assessed by the activating phosphorylation of ASK1, JNK, and p38 as determined by Western blot analysis. D) Quantitative comparison of the levels of total protein and signaling activation by density scanning of the blots in panel C. Glyceraldehyde 3-phosphate dehydrogenase (GAPDH) was used as loading control. Data are expressed as means 6 SEM (n = 3). *P , 0.05, **P , 0.01, ***P , 0.001.
Article Snippet: For in vitro experiments, AP20187 (
Techniques: Activation Assay, Over Expression, Construct, Stable Transfection, Phospho-proteomics, Western Blot, Comparison, Control